Charts.kt is pure Kotlin code, add charts to your Android projects with a powerful Kotlin DSL.
Charts.kt
The Kotlin charting library
for iOS, Android, the Web, Desktop, and server (SVG).
Features
Environments
Android
The Web
Enjoy a strongly typed charting library for your Kotlin/JS projects without performance compromises.
Desktop
Build a complete JavaFX charting application and benefits from Charts.kt robust DSL to boost your productivity.
Multiplatform
Write your code once and deploy your charts on any platform, they look, behave and react exactly the same!
Charts types
Line chart
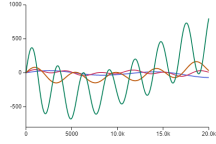
- Straight line
- Spline
- Step line
- Continous / discrete
- Handle null values
- Multi-series
- ...
Bar chart
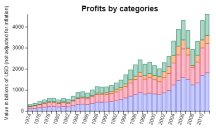
- Bars / columns
- Stacking available
- Custom bandwidth
- Floating bars
- Handle null values
- ...
Area chart
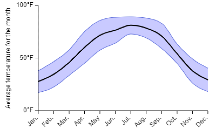
- Straight / spline / step
- Overlapped or stacked
- Area range
- Handle null values
- ...
Scatter plot
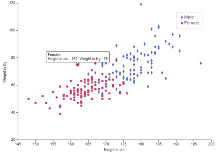
- Use any marker
- Easy customization
- Continous / discrete
- Multi-series
- ...
Bubble chart
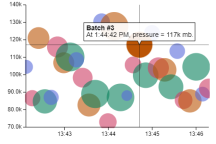
- Use any shape
- Easy customization
- Continous / discrete
- Multi-series
- ...
Box plot
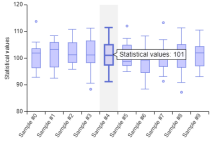
- Candle chart
- Box and whiskers
- Direct access to your values
- ...
Combo chart
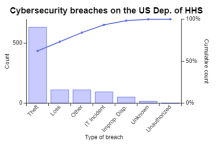
Create combo charts by mixing any number of marks or use built-in charts like:
- Pareto
- SPC chart
- Density curve...
Custom chart
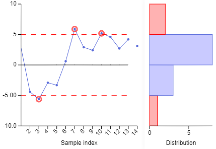
There's a ton of options to create your own chart: themes, inline style, decorators... you can even create your own chart by implementing Charts.kt interfaces.
Basic features
Tooltip
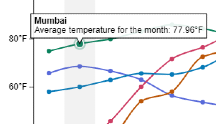
Charts.kt automatically generate a tooltip based on the values and "smart formatters" but you can handle it yourself to display any information you need.
Cursor
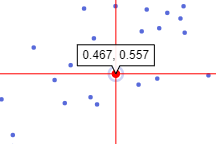
You have multiple cursor choices, by default, Charts.kt picks the best option to enhance your chart readability, but everything is configurable.
Legend
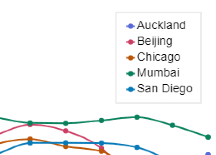
Legend is generated automatically, and you don't have to worry about its layout.
Still, everything is customizable.
Intelligent configuration
Each chart uses by default the best configuration for a result that respects the standards:
- ISO-compliant formatters
- Colorblind-friendly palettes
- Smart UI choices for every chart
- Robust DSL
- Type checking
- ...
Advanced features
Multi Axes
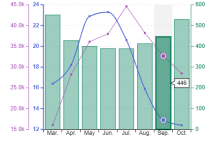
You can have multiple axes or you can use the same axis for multiple properties, you can even mix different axes types (temporal, numeric, discrete).
Custom scales
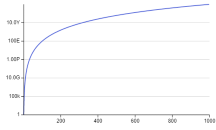
Need a logarithmic scale? A power scale? Or your own transformation scale?
Charts.kt accepts any scale that is based on the Data2Viz standard.
Performance
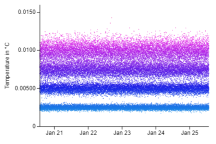
Enable "performance mode" to display thousands of records without sacrificing responsiveness.
Charts.kt goal is to display 100'000 records in less than a second on any platform.
Locale and formatting
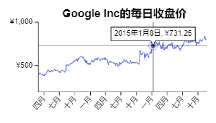
Charts.kt provides a lot of locales and formatting options for numbers (scientific, percentage...) and dates (hour:minute, full date...).
Interactivity
Chart events
Charts.kt DSL is 100% Kotlin code so you can very easily bind on events or control the chart from your application.
Zoom and pan
Zoom and pan with gestures or mouse depending on your platform.
Force X and/or Y zoom only, or fix value limits in chart's parameters.
Synchronize events
Share events between multiple charts: each event contains all the information and data needed to synchronize it between charts.
Synchronize layouts
Display data along multiple charts and synchronize their layouts to ensure that all axes are perfectly aligned.
Style & customization
Themes
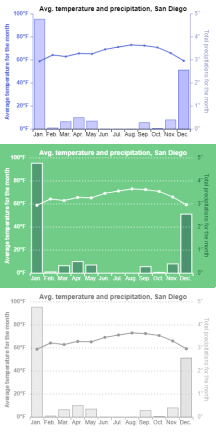
Choose between multiple built-in themes (dark mode...) or create your own to change the look and feel of all your charts.
Utility marks
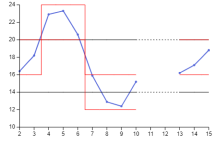
Use "utility marks" to draw on your chart: limit lines, trends... They share the same properties as your other marks.
Decorators
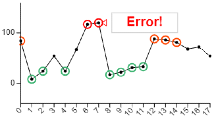
Decorators are a very convenient way to customize your chart by drawing directly on it without having to care about screen coordinates.
Accessibility
Default color schemes offers high contrast.
Control your charts through gestures, mouse and keyboard.
"Smart layout" makes the most of the available size to maintain readability even when resizing.