Our story

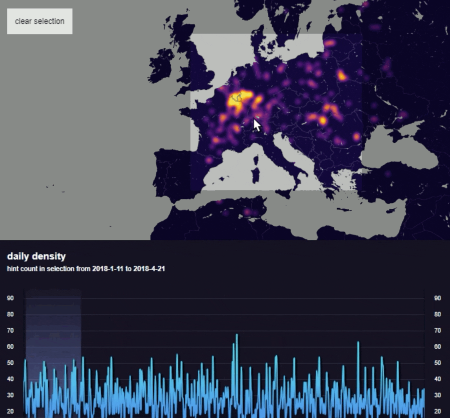
We started in 2017 by creating an open-source data visualization library: data2viz.
At the beginning of 2018, we founded the company in Geneva, using the library’s name. We started to work with different customers creating data visualizations based on the open-source library.
We rapidly identify the need for a high-level charting library, so we began working on Charts.kt at the end of 2018.
Version 1.0 of Charts.kt is launched at the beginning of 2021.


