Synchronize charts display
In this guide you'll see how to:
✔️ Synchronize the display sizes of several charts
✔️ Synchronize the cursors of several charts
✔️ Synchronize the viewport (zoom & pan) of several charts
Find a similar Javascript example code here: https://play.data2viz.io/sketches/MYnMqL/edit/
Case study
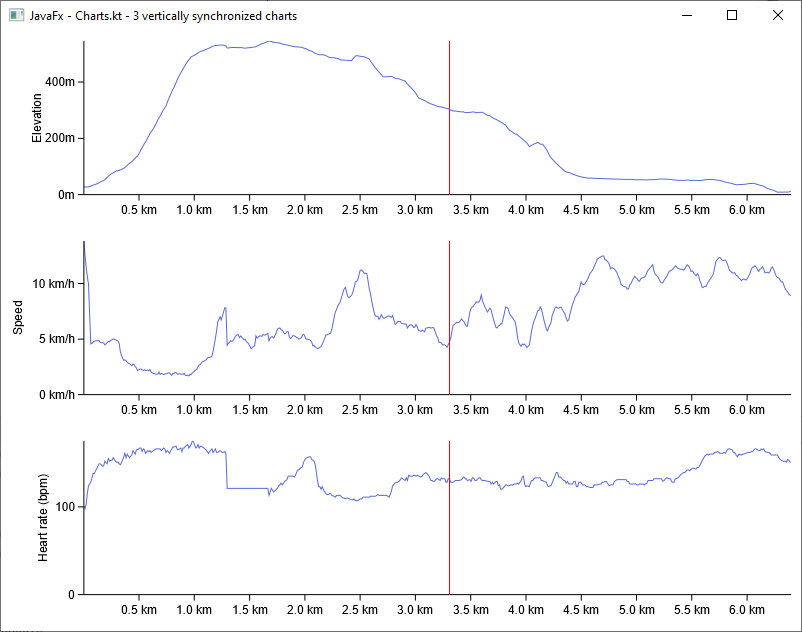
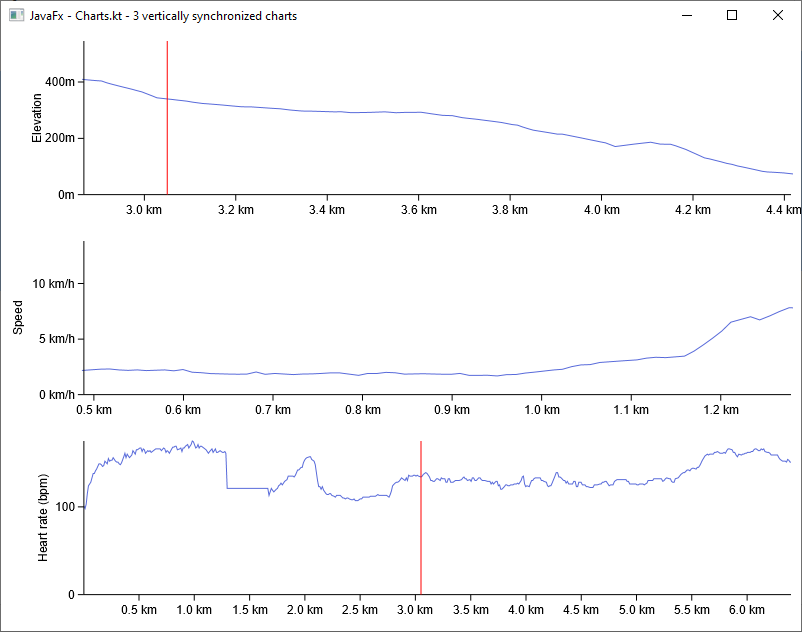
Let's have a look at this application where 3 vertically aligned charts share the same X-axis.
If you want these charts to work in perfect synchronization, you need to ensure that:
- your application layout aligns the canvases of your charts
- your charts share a common dataset and at least one common dimension
- your charting zones have all the exact same width
- highlighting a data point on one chart is reflected on the others
- your x-axes keep synchronized even when zooming or panning one chart
Application layout
Charts-kt is a multiplatform library, so let's skip the details and say that you create your application grid-layout with the framework of your choice.
When you have your 3 container elements (Div, Pane... depending on your target platform) that are placed correctly and responsive you can create VizContainers out of them. They are sized from the base component and your charts will be displayed in it.
val root = VBox()

val paneContainer = Pane()
root.children.add(paneContainer)

val myVizContainer = paneContainer.newVizContainer()
myVizContainer.size = Size(myApplication.width, myApplication.height / 3.0)

val myChart = myVizContainer.chart(data) {
		...
}
Common Dimension (and common dataset)
It's not true that your charts "share" the same X-axis.
In fact, they all have their own axis, but each of these axes is created with the exact same Dimension and the exact same dataset.
chart(data) {

    val distanceDimension = quantitative( { domain.distance }) {
        formatter = { "${this} km"}
    }

}
You can synchronize charts that do not "share" common dimensions or a common dataset but be careful as this may produce unintended bias in the chart's comprehension.
Size synchronization
After creating 3 Canvas element for your 3 charts, you display them and see that their sizes vary:
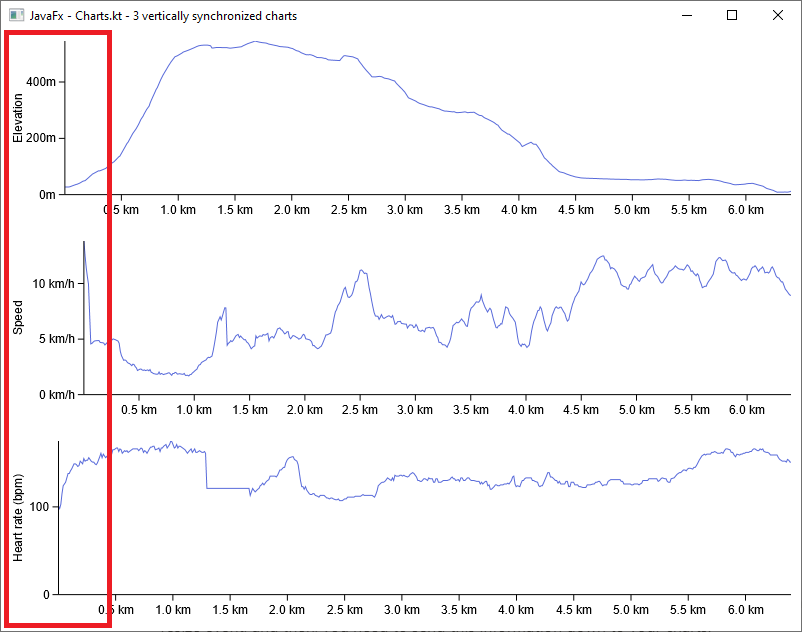
As you can see, the second chart uses wider labels for its Y-axis and so its main drawing zone is smaller and the axes are not aligned as expected.
To force these charts to be perfectly aligned, you need to define some rules for synchronizing the width of the charts in your application considering the constraints created by your layout.
The first thing to do is to instantiate a SizeManager, this manager stores layout constraints and triggers size synchronization when needed.
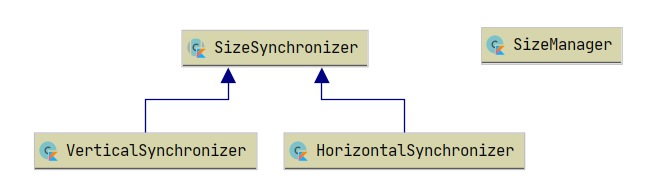
Let's simply create a VerticalSynchronizer and add all 3 charts:
val sizeManager = SizeManager()
val vSynchronizer = sizeManager.vSynchro()

vSynchronizer.addAllCharts(chart1, chart2, chart3)
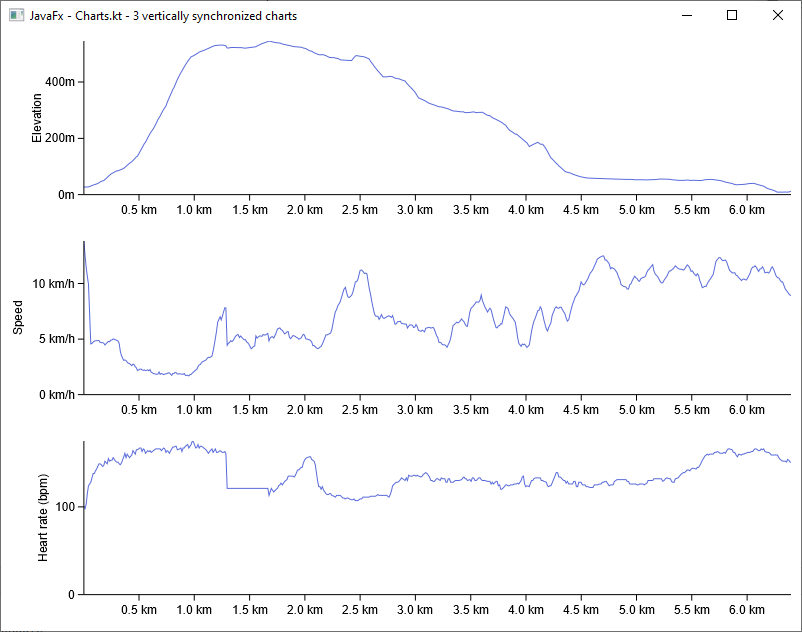
Now, the constraints of each chart are applied to every other chart and the charts are perfectly aligned:
Responsive layout & synchronization
If you have a responsive layout and you want your charts to be resized, then you need to:
- listen to the resize event of your application and resize your charts
- call the
SizeManager.synchronize()function
myApplication.onResize { evt ->
	  val newWidth = evt.width                  // each chart takes 100% of the app's width
	  val newHeight = evt.height / 3.0          // each chart's height is 1/3 of the app's

	  val newChartSize = Size(newWidth, newHeight)

	  chart1.size = newChartSize
	  chart2.size = newChartSize
	  chart3.size = newChartSize

    sizeManager.synchronize()
}
The manual call to
SizeManager.synchronize()is mandatory as the synchronization of charts is not automatic (this would cause too much resync. each time a chart is resized).
Highlight synchronization
With 3 charts that share the same X-axis you may also want to share interactions.
As these charts are vertically aligned, a good start would be to share the "highlighting" of a data point.
As all your information is presented along a horizontal X-axis, a good start would be to reflect this by using a vertical cursor, and a trigger mode set to "column" which allows for selecting data points based on their X position.
chart(data) {

    cursor {
        type = Cursor.Type.Vertical
    }

    triggerMode = TriggerMode.Column

    ...
}
Then, synchronizing the highlight is very simple here, just catch the event from a chart and pass it to the others:
chart0.onHighlight { evt ->
    chart1.highlight(evt.data)
    chart2.highlight(evt.data)
}
chart1.onHighlight { evt ->
    chart0.highlight(evt.data)
    chart2.highlight(evt.data)
}
chart2.onHighlight { evt ->
    chart1.highlight(evt.data)
    chart0.highlight(evt.data)
}

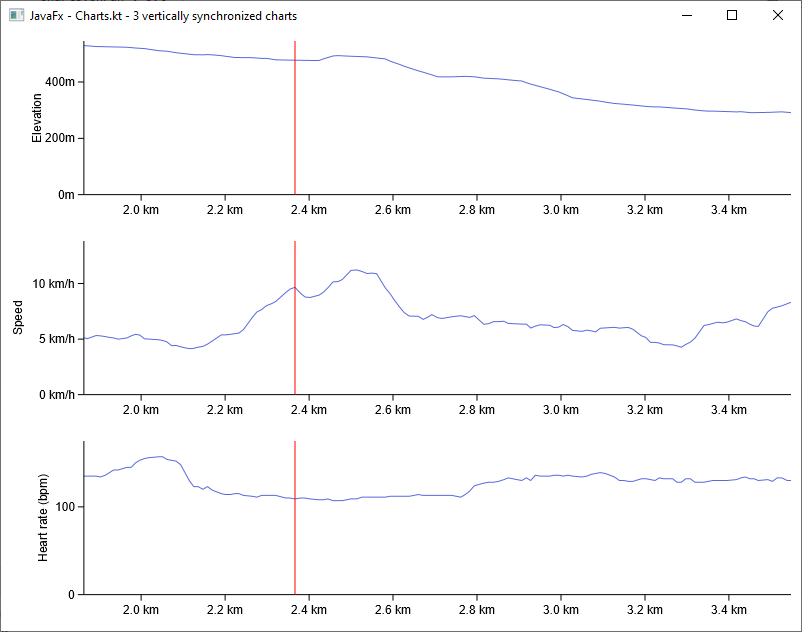
Zoom & Pan synchronization
Of course, as you want your charts to keep synchronized, if you enable panning and zooming in any of them, you need to synchronize it with the rest.
On this example, let's enable a X zooming and panning on the charts:
chart(data) {

    zoomMode = ZoomMode.X
    panMode = PanMode.X

    ....
}
However, when you zoom/pan on a chart, you lose the synchronization of your viewports:
Considering that your charts are perfectly aligned and have the same sizes, forcing the zoom and pan synchronization is really easy, just catch the events and pass them to the other charts:
chart0.onZoom { evt ->
    chart1.zoom(evt.zoomOriginX, evt.zoomOriginY, evt.zoomFactorX, evt.zoomFactorY)
    chart2.zoom(evt.zoomOriginX, evt.zoomOriginY, evt.zoomFactorX, evt.zoomFactorY)
}
chart0.onPan { evt ->
    chart1.pan(evt.panX, evt.panY)
    chart2.pan(evt.panX, evt.panY)
}
The displayed range of data is now synchronized for the 3 charts:
Learn why Zoom & Pan properties are relative and expressed in percent.