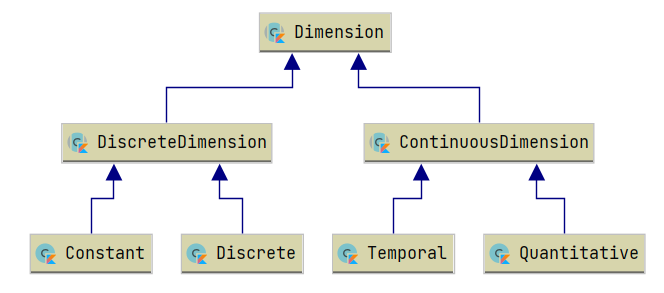
Dimensions
Dimensions are a core concept of Charts-kt, every chart needs dimensions to explain which properties will be displayed, and how they'll be displayed.
In order to do this, a dimension describes:
- The type of the data
- How to access the data
The dimension's type
The dimension's choice defines the type of your data.
There are 4 types of dimension:
Quantitative, for continuous numeric valuesTemporal, for continuous temporal valuesDiscrete, for discrete values or "categories"Constant, for values that cannot change
Let's consider this Kotlin data class TemperatureRecord:
data class TemperatureRecord(
	val temperature: Double,
	val location: Town,
	val time: Instant
)
If you want to translate this class' values into dimensions, you could write this:
chart(temperatureRecords) {

	val temperatureDimension = quantitative( { domain.temperature } )
	val timeDimension =        temporal    ( { domain.time        } )
	val locationDimension =    discrete    ( { domain.location    } )
}
Choosing the right dimension type (quantitative, temporal, discrete) is crucial to describe how to handle your data.
The dimension's accessor (how to access the data)
As you've seen above, a dimension is instantiated through a function that defines its type, and a parameter which is a lambda that is called the accessor.
The accessor defines how to access the property from your domain object.
Depending on the dimension, only certain types are allowed:
- Quantitative dimension only accepts
Double?(nullable Double) properties - Temporal dimension only accepts
Instantproperties - Discrete and Constant dimensions can manage
Anytypes
Choosing the right dimension
To create a good chart, it is crucial to choose the right representation for your data, it goes the same with dimension, each dimension has its specificities.
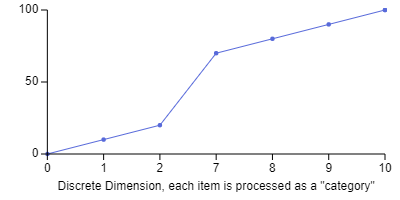
Look at these 2 charts, they use the exact same dataset, but the first one use a quantitative dimension for its X-axis, and the second chart a discrete one, you can see that the results are quite different:
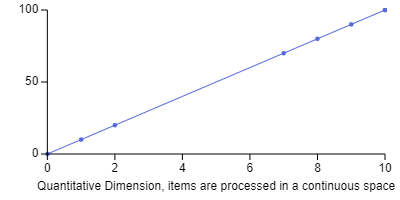
Quantitative
Quantitative data expresses some kind of quantity: 7.3, -220, 0.36, etc... the values can be expressed as Double?.
Quantitive data exists in a continuous numeric space, and the standard representation for this type of data are lines or plots...
Temporal
Temporal data supports date-times and times such as "2015-03-07 12:32:17", "17:01", "2015-03-16". "2015", 1552199579097 (timestamp), etc... the values can be expressed as Instant.
Temporal data exists in a continuous time space, and the standard representation for this type of data are lines or plots...
Discrete
Discrete data, also known as categorical data, differentiate between values based only on their names or categories. For example, gender, nationality, music genre, and name are discrete data.
The underlying value can be of any type, even nullable.
As opposed to quantitative data, there is no notion of a relative degree of difference between them. It means that, even if the data is stored, say as an Int, like (1, 2, 3, 6, 20), we cannot compare them, and "1" is handled as a single category just as "2" or "20".
Discrete data exists in a discrete space, and the standard representation for this type of data are bars, columns...
Constant
Constant data can be of any type, and, as it names implies, never change value.
This is a special Dimension, used to emphasize the fact that your data is expected to always have the same value.
Constant data exists in a discrete space, and there is no "standard representation" for this type of data... who need charting if the data never change?
Constant data/dimension is mainly used for allowing optimization at runtime, for example, if you set the strokeColor and the strokeWidth of your line to a constant, the rendering can be faster as it doesn't need to evaluate these properties for each data point.
chart(records) {

	(...)

	line {
		strokeColor = constant(Colors.Web.black)
		strokeWidth = constant(2.0)
	}
}