Creating your first JavaFX chart app, part 1
Let's see step-by-step how to create a JavaFX application that uses Charts-kt.
This tutorial will help you understand how to:
- Set up a Kotlin JavaFX project
- Import the libraries you need using your licence keys
- Create your first chart in a JavaFX application and launch it
What do you need?
- 15 minutes
- JDK 1.8 (or later)
- Intellij Community or Ultimate (tested with IntelliJ 2020.3.*)
Creating the Kotlin JavaFX project
IntelliJ IDEA is the editor of choice for a Kotlin project. This tutorial works with the community (free) edition of IDEA as well as the ultimate edition.
Let's start by creating a new Kotlin project, and choose JVM Application.
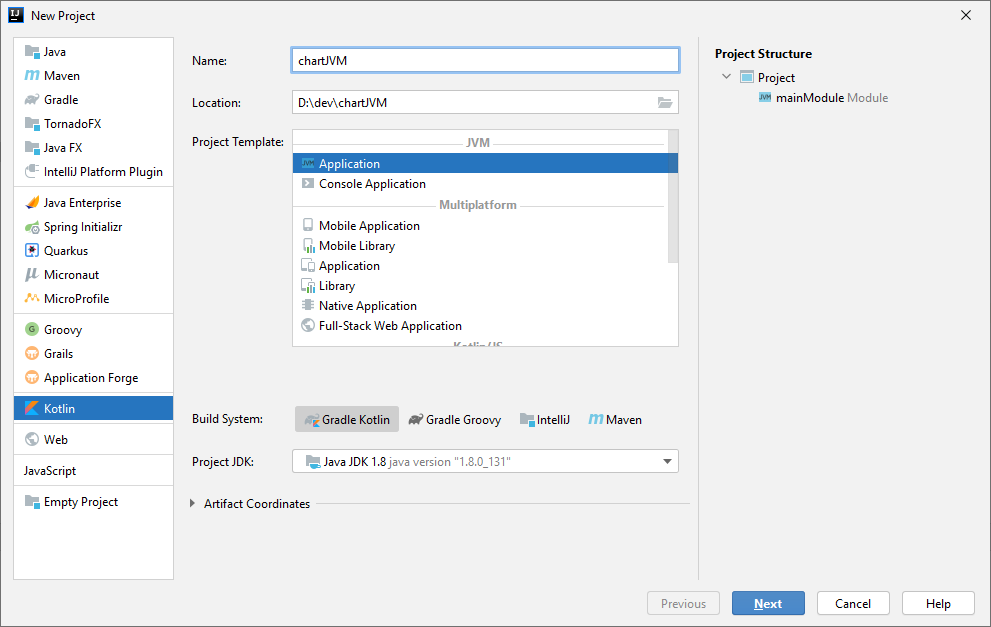
Choose the name and location of your project.
As for the build system, Gradle is the preferred option but Maven also works.
We'll choose Gradle Kotlin for this tutorial, you can change it if you're more comfortable with Groovy.
Choosing the JDK
Concerning the JDK, you can either run the project with:
- Java 8, as this JDK includes JavaFX
- Java 9 or later, but you'll need to import the required JavaFX modules. You can check Getting started with JavaFX for detailed information. For our Gradle Kotlin project, this requires adding these lines to your
build.gradle.ktsfile:
plugins {
    kotlin("jvm") version "1.4.31"
    id("application")
    id("org.openjfx.javafxplugin") version "0.0.9"
}

javafx {
    version = "15.0.1"
    modules = listOf("javafx.controls")
}
Checking the project
Finish the project creation wizard, then create a first Main.kt file with a main function to validate that the configuration is ok.
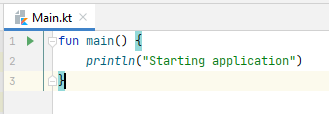
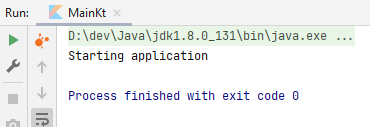
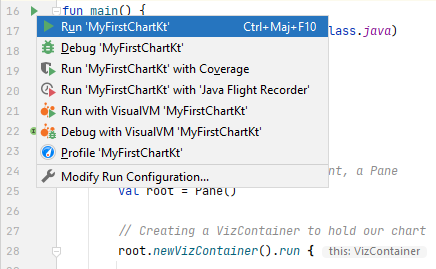
Launch it by clicking on the green triangle on the left gutter of the editor, your project should build and start this first program:
Importing the libraries
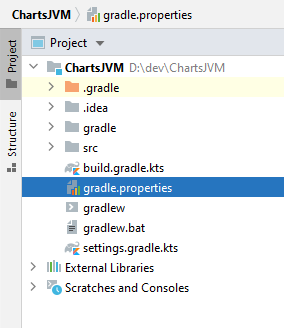
First, let's add in the gradle.properties file of the project, two properties for the versioning of our libraries:
// choose the last stable versions!
d2vVersion=0.8.12
chartsVersion=1.1.0-eap1
The EAP version of charts is for development use only and displays a watermark on every chart but it did not require any license.
Then add this code in the build.gradle.kts file at the root of your project to specify the repositories, credentials, and versions used.
val d2vVersion: String by project
val chartsVersion: String by project

repositories {
    maven{
        url = uri("https://maven.pkg.jetbrains.space/data2viz/p/maven/dev")
    }
    maven{
        url = uri("https://maven.pkg.jetbrains.space/data2viz/p/maven/public")
    }
}
mavenCentral()

dependencies {
    testImplementation(kotlin("test-js"))
    implementation("org.jetbrains.kotlinx:kotlinx-html:0.7.2")

    implementation ("io.data2viz.d2v:core-jvm:$d2vVersion")
    implementation ("io.data2viz.charts:core:$chartsVersion")
}
Note that you're importing the Charts-kt library, but also the core module of the data2viz open-source library which contains a lot of basic stuff you'll need to create your charts.
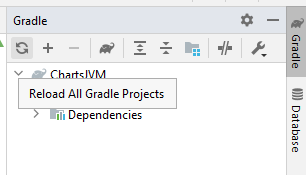
Now, reload your Gradle project if this had not already been done by clicking on your Gradle tab's "refresh" button. You should get a BUILD SUCCESSFUL result.
Creating your first application
Now let's dive into the code and create a very simple chart to check that everything is working as expected. Paste this code in your Main.kt file.
import io.data2viz.charts.chart.chart
import io.data2viz.charts.chart.mark.plot
import io.data2viz.charts.chart.quantitative
import io.data2viz.charts.viz.newVizContainer
import io.data2viz.geom.Size
import javafx.application.Application
import javafx.scene.Scene
import javafx.scene.layout.Pane
import javafx.stage.Stage

private val width = 300.0
private val height = 300.0

private val values = listOf(1.0, 2.0, 3.0, 4.0, 5.0)

fun main() {
    Application.launch(MyFirstChart::class.java)
}

class MyFirstChart: Application() {

    override fun start(stage: Stage) {

        // Creating the JFX root element, a Pane
        val root = Pane()

        // Creating a VizContainer to hold our chart
        root.newVizContainer().run {

            // Size the VizContainer
            size = Size(width, height)

            // Create a first simple Chart
            chart(values) {
                val values = quantitative({domain})
                plot(values, values)
            }
        }

        // Launch our Scene
        stage.apply {
            title = "My first chart!"
            scene = (Scene(root, width, height))
            show()
        }
    }
}
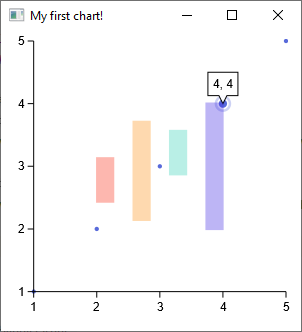
Launch your JavaFX application that contains your first chart by running the main() function of your application.
The result should look like this: