Creating your first Kotlin JS chart app, part 3
This third tutorial details charts events and interactions.
This tutorial will help you understand:
- What are the different chart events
- How-to listen to events
- How-to push events
What do you need?
- 15 minutes
- A working Kotlin JS environment (see part 1)
- Intellij Community or Ultimate (tested with IntelliJ 2020.3.*)
The chart events
There are 4 chart events you can bind on, here is a cheat sheet presenting all of them:
Highlight event
- This event is a Data Event, it takes and returns
DOMAINobjects - This event is enabled by default, disable it with
config.events.highlightMode - Listen:
chart.onHighlight(listener: (event: HighlightEvent<DOMAIN>) -> Unit) - Push:
chart.highlight(domains: Collection<DOMAIN>)orchart.highlight(data: Collection<Datum<DOMAIN>>)
Select event
- This event is a Data Event, it takes and returns
DOMAINobjects - This event is disabled by default, disable it with
config.events.selectionMode - Listen:
chart.onSelect(listener: (event: SelectEvent<DOMAIN>) -> Unit) - Push:
chart.select(domains: Collection<DOMAIN>)orchart.select(data: Collection<Datum<DOMAIN>>)
Zoom event
- This event is a View Event, it applies transformation to the current charting zone
- This event is disabled by default, disable it with
config.events.zoomMode - Listen:
chart.onZoom(listener: (event: ZoomEvent) -> Unit) - Push:
chart.zoom(zoomOriginX, zoomOriginY, zoomFactorX, zoomFactorY)
Pan event (scroll event)
- This event is a View Event, it applies transformation to the current charting zone
- This event is disabled by default, disable it with
config.events.panMode - Listen:
chart.onPan(listener: (event: PanEvent) -> Unit) - Push:
chart.pan(panX: Percent, panY: Percent)
Chart events types
As their name implies, data events take and return "data".
You can trigger an on-screen selection by calling chart.select() with a list of DOMAIN objects.
Similarly, when a user selects stuff on screen, you can retrieve the list of underlying domain objects by listening to the SelectEvent.
View events are related to the "view" of your chart, the main drawing zone, here, in blue.
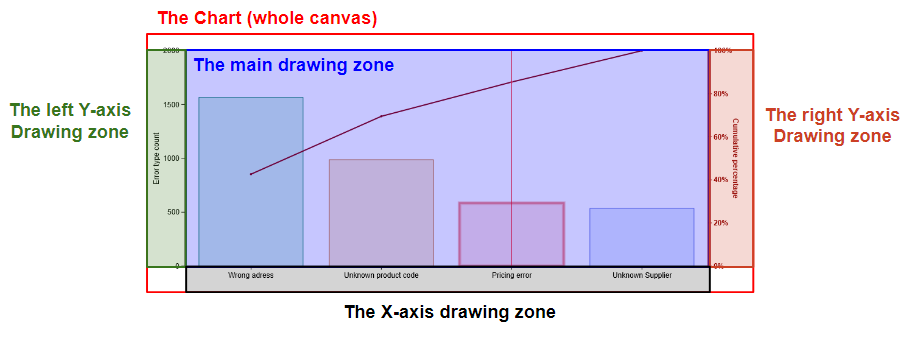
View events do not return data but rather indicate how much the view has changed from its initial position.
Receiving and pushing chart events
Listening to events
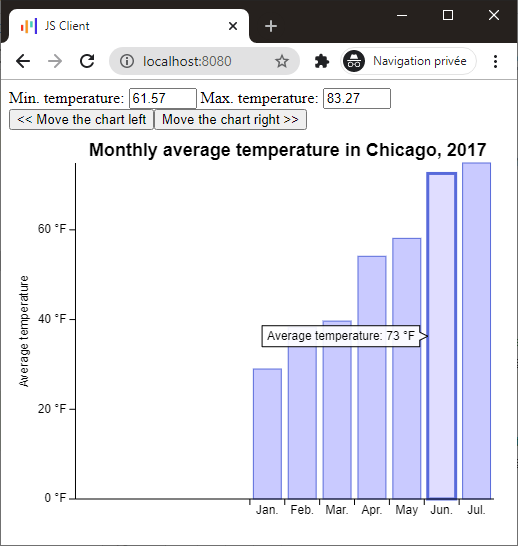
From the previous "weather app" (see part 2) we want to add 2 input fields inputMin and inputMax to display the min and max temperature of a highlighted item.
Create these fields, then create a function that takes 2 Double and displays their values in the corresponding fields, let's call this function updateFields:
import io.data2viz.charts.chart.chart
import io.data2viz.charts.chart.discrete
import io.data2viz.charts.chart.mark.bar
import io.data2viz.charts.chart.quantitative
import io.data2viz.charts.core.formatToInteger
import io.data2viz.charts.event.HighlightEvent
import io.data2viz.charts.viz.newVizContainer
import io.data2viz.format.Locales
import io.data2viz.geom.Size
import kotlinx.browser.document
import kotlinx.browser.window
import kotlinx.html.*
import kotlinx.html.dom.append
import org.w3c.dom.HTMLInputElement
import org.w3c.dom.Node
import org.w3c.fetch.Response
import kotlin.js.Promise

private val width = 500.0
private val height = 400.0

private val months = listOf("Jan.", "Feb.", "Mar.", "Apr.", "May", "Jun.", "Jul.", "Aug.", "Sep.", "Oct.", "Nov.", "Dec.")
private val city = "Chicago"
private val year = 2017

private val fileName =
    "https://docs.google.com/spreadsheets/d/e/2PACX-1vTX4QuCNyDvUo" +
            "Awk6Jl6UJ4r336A87VIKQ5BVyEgowXG_raXdFBMvmUhmz1LLc07Ga" +
            "vyC9J6pZ4YHqJ/pub?gid=650761999&single=true&output=csv"

fun Node.createEventsChart() {

    val request: Promise<Response> =
        window.fetch(fileName)

    request.then { response ->
        response.text().then { csvContent ->
            val weatherData = parseWeatherCSV(csvContent)
            val chicago2017 = weatherData.filter {
                it.city == city && it.year == year
            }

            append {
                div {
                    span {
                        +" Min. temperature: "
                    }
                    input(InputType.text) {
                        id = "inputMin"
                        style = "width: 60px;"
                        value = "0"
                    }
                    span {
                        +" Max. temperature: "
                    }
                    input(InputType.text) {
                        id = "inputMax"
                        style = "width: 60px;"
                        value = "0"
                    }
                }
                div {

                    val vc = newVizContainer().apply {
                        size = Size(width, height)
                    }
                    vc.chart(chicago2017) {

                        title = "Monthly average temperature in $city, $year"

                        val monthDimension = discrete( { domain.month } ) {
                            formatter = { months[this-1] }
                        }
                        val temperatureDimension = quantitative( { domain.avgTemp } ) {
                            name = "Average temperature"
                            formatter = { "${this.formatToInteger(Locales.en_US)} °F" }
                        }

                        bar(monthDimension, temperatureDimension) {
                            onHighlight { event: HighlightEvent<Weather> ->
                                val domain = event.data.firstOrNull()?.domain
                                updateFields(domain?.lowTemp ?: .0, domain?.highTemp ?: .0)
                            }
                        }
                    }
                }
            }
        }
    }
}

private val updateFields: (Double, Double) -> Unit = { min, max ->
    (document.getElementById("inputMin") as HTMLInputElement).value = min.toString()
    (document.getElementById("inputMax") as HTMLInputElement).value = max.toString()
}
Now plug function on an onHighlight listener.
The HighlightEvent contains a data property, which is here a Collection<Datum<Weather>>.
On a bar chart your visuals don't overlap, meaning you can't highlight 2 different items, so this collection is whether empty or contains a single element. Just take this element and pass the min and max temperature to the callback function.
import io.data2viz.charts.chart.chart
import io.data2viz.charts.chart.discrete
import io.data2viz.charts.chart.mark.bar
import io.data2viz.charts.chart.quantitative
import io.data2viz.charts.core.formatToInteger
import io.data2viz.charts.event.HighlightEvent
import io.data2viz.charts.viz.newVizContainer
import io.data2viz.format.Locales
import io.data2viz.geom.Size
import kotlinx.browser.document
import kotlinx.browser.window
import kotlinx.html.*
import kotlinx.html.dom.append
import org.w3c.dom.HTMLInputElement
import org.w3c.dom.Node
import org.w3c.fetch.Response
import kotlin.js.Promise

private val width = 500.0
private val height = 400.0

private val months = listOf("Jan.", "Feb.", "Mar.", "Apr.", "May", "Jun.", "Jul.", "Aug.", "Sep.", "Oct.", "Nov.", "Dec.")
private val city = "Chicago"
private val year = 2017

private val fileName =
    "https://docs.google.com/spreadsheets/d/e/2PACX-1vTX4QuCNyDvUo" +
            "Awk6Jl6UJ4r336A87VIKQ5BVyEgowXG_raXdFBMvmUhmz1LLc07Ga" +
            "vyC9J6pZ4YHqJ/pub?gid=650761999&single=true&output=csv"

fun Node.createEventsChart() {

    val request: Promise<Response> =
        window.fetch(fileName)

    request.then { response ->
        response.text().then { csvContent ->
            val weatherData = parseWeatherCSV(csvContent)
            val chicago2017 = weatherData.filter {
                it.city == city && it.year == year
            }

            append {
                div {
                    span {
                        +" Min. temperature: "
                    }
                    input(InputType.text) {
                        id = "inputMin"
                        style = "width: 60px;"
                        value = "0"
                    }
                    span {
                        +" Max. temperature: "
                    }
                    input(InputType.text) {
                        id = "inputMax"
                        style = "width: 60px;"
                        value = "0"
                    }
                }
                div {

                    val vc = newVizContainer().apply {
                        size = Size(width, height)
                    }
                    vc.chart(chicago2017) {

                        title = "Monthly average temperature in $city, $year"

                        val monthDimension = discrete( { domain.month } ) {
                            formatter = { months[this-1] }
                        }
                        val temperatureDimension = quantitative( { domain.avgTemp } ) {
                            name = "Average temperature"
                            formatter = { "${this.formatToInteger(Locales.en_US)} °F" }
                        }

                        bar(monthDimension, temperatureDimension) {
                            onHighlight { event: HighlightEvent<Weather> ->
                                val domain = event.data.firstOrNull()?.domain
                                updateFields(domain?.lowTemp ?: .0, domain?.highTemp ?: .0)
                            }
                        }
                    }
                }
            }
        }
    }
}

private val updateFields: (Double, Double) -> Unit = { min, max ->
    (document.getElementById("inputMin") as HTMLInputElement).value = min.toString()
    (document.getElementById("inputMax") as HTMLInputElement).value = max.toString()
}
Create a new EventsChart.kt file and paste this code (click on the "+" icon to see the full code), change once again the call in your client.kt file, then refresh, you should see this result:
Pushing events
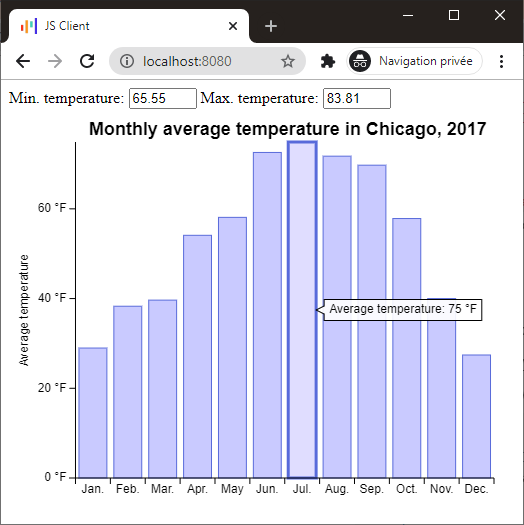
Let's say that your application handles scrolling so you want to disable pan in your chart, and control it from your app.
Add a second div in your page with 2 buttons: moveLeft and moveRight.
Each of these buttons will "pan" the chart's view by 1/12 (8.33%):
import io.data2viz.charts.chart.Chart
import io.data2viz.charts.chart.chart
import io.data2viz.charts.chart.discrete
import io.data2viz.charts.chart.mark.bar
import io.data2viz.charts.chart.quantitative
import io.data2viz.charts.core.formatToInteger
import io.data2viz.charts.event.HighlightEvent
import io.data2viz.charts.viz.newVizContainer
import io.data2viz.format.Locales
import io.data2viz.geom.Size
import io.data2viz.math.pct
import kotlinx.browser.document
import kotlinx.browser.window
import kotlinx.html.*
import kotlinx.html.dom.append
import kotlinx.html.js.onClickFunction
import org.w3c.dom.HTMLInputElement
import org.w3c.dom.Node
import org.w3c.fetch.Response
import kotlin.js.Promise

private val width = 500.0
private val height = 400.0

private val months = listOf("Jan.", "Feb.", "Mar.", "Apr.", "May", "Jun.", "Jul.", "Aug.", "Sep.", "Oct.", "Nov.", "Dec.")
private val city = "Chicago"
private val year = 2017

private val fileName =
    "https://docs.google.com/spreadsheets/d/e/2PACX-1vTX4QuCNyDvUo" +
            "Awk6Jl6UJ4r336A87VIKQ5BVyEgowXG_raXdFBMvmUhmz1LLc07Ga" +
            "vyC9J6pZ4YHqJ/pub?gid=650761999&single=true&output=csv"

fun Node.createEventsChart() {

    val request: Promise<Response> =
        window.fetch(fileName)

    request.then { response ->
        response.text().then { csvContent ->
            val weatherData = parseWeatherCSV(csvContent)
            val chicago2017 = weatherData.filter {
                it.city == city && it.year == year
            }

            lateinit var weatherChart: Chart<Weather>

            append {
                div {
                    span {
                        +" Min. temperature: "
                    }
                    input(InputType.text) {
                        id = "inputMin"
                        style = "width: 60px;"
                        value = "0"
                    }
                    span {
                        +" Max. temperature: "
                    }
                    input(InputType.text) {
                        id = "inputMax"
                        style = "width: 60px;"
                        value = "0"
                    }
                }
                div {
                    button {
                        id = "moveLeft"
                        text("<< Move the chart left")
                        onClickFunction = { weatherChart.pan((-8.333).pct, 0.pct) }
                    }
                    button {
                        id = "moveRight"
                        text("Move the chart right >>")
                        onClickFunction = { weatherChart.pan(8.3333.pct, 0.pct) }
                    }
                }
                div {

                    val vc = newVizContainer().apply {
                        size = Size(width, height)
                    }
                    weatherChart = vc.chart(chicago2017) {

                        title = "Monthly average temperature in $city, $year"

                        val monthDimension = discrete( { domain.month } ) {
                            formatter = { months[this-1] }
                        }
                        val temperatureDimension = quantitative( { domain.avgTemp } ) {
                            name = "Average temperature"
                            formatter = { "${this.formatToInteger(Locales.en_US)} °F" }
                        }

                        bar(monthDimension, temperatureDimension) {
                            onHighlight { event: HighlightEvent<Weather> ->
                                val domain = event.data.firstOrNull()?.domain
                                updateFields(domain?.lowTemp ?: .0, domain?.highTemp ?: .0)
                            }
                        }
                    }
                }
            }
        }
    }
}

private val updateFields: (Double, Double) -> Unit = { min, max ->
    (document.getElementById("inputMin") as HTMLInputElement).value = min.toString()
    (document.getElementById("inputMax") as HTMLInputElement).value = max.toString()
}
By default, panning is disabled in your chart: this concerns the user interactions. Your users cannot scroll in the chart, still, you can always call
chart.pan()and control the scroll from your application.
Replace your code with the code above and refresh your page, you now should be able to move your chart right and left by clicking on the buttons: