Creating your first JavaFX chart app, part 4
This fourth tutorial will explain how charts synchronization works.
This tutorial will help you understand how-to:
- Synchronize charts using events
- Synchronize multiple charts' layouts using a SizeManager
What do you need?
- 15 minutes
- A working JavaFX environment (see part 1)
- Intellij Community or Ultimate (tested with IntelliJ 2020.3.*)
Synchronizing charts events
When you have, in your application, distinct charts with related data, it may be relevant to synchronize them (axes, selection, highlighted item...).
The standard case is when you want to visualize different dataset values through different charts.
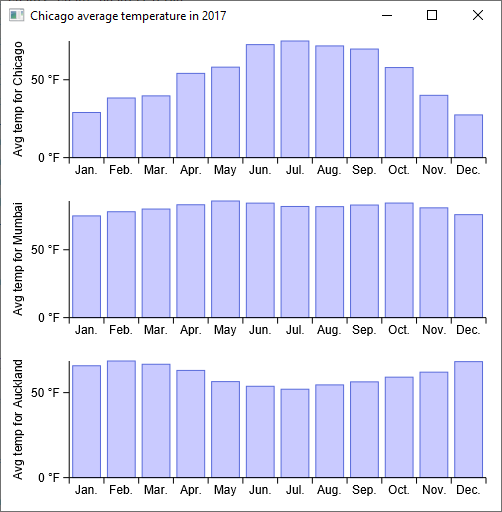
Let's do this and display 3 different cities' weather charts. Start by loading the weather statistics for Chicago, Mumbai, and Auckland, then create a chart for each city.
import io.data2viz.charts.chart.Chart
import io.data2viz.charts.chart.chart
import io.data2viz.charts.chart.discrete
import io.data2viz.charts.chart.mark.bar
import io.data2viz.charts.chart.quantitative
import io.data2viz.charts.core.formatToInteger
import io.data2viz.charts.viz.VizContainer
import io.data2viz.charts.viz.newVizContainer
import io.data2viz.format.Locales
import io.data2viz.geom.Size
import javafx.application.Application
import javafx.scene.Scene
import javafx.scene.layout.Pane
import javafx.scene.layout.VBox
import javafx.stage.Stage
import java.io.File

fun main() {
    Application.launch(MultiChart::class.java)
}

private val width = 500.0
private val height = 160.0

private val months =
    listOf("Jan.", "Feb.", "Mar.", "Apr.", "May", "Jun.", "Jul.", "Aug.", "Sep.", "Oct.", "Nov.", "Dec.")

private val year = 2017

private fun loadData(cityName: String): List<Weather> {
    val csvContent = File("./src/main/resources/Weather - Stats.csv").readText()
    val weatherData = parseWeatherCSV(csvContent)
    val filteredData = weatherData.filter { weather: Weather ->
        weather.city == cityName && weather.year == year
    }
    return filteredData
}

class MultiChart : Application() {

    override fun start(stage: Stage) {

        val root = VBox()

        val citiesNames = listOf("Chicago", "Mumbai", "Auckland")
        val citiesWeather = citiesNames.map { loadData(it) }

        val chartPanes = citiesNames.map { Pane() }
        root.children.addAll(chartPanes)

        val charts = citiesNames.mapIndexed { index, cityName ->
            chartPanes[index].newVizContainer().run {
                size = Size(width, height)
                createChart(citiesWeather[index], cityName)
            }
        }

        // Launch our Scene
        stage.apply {
            title = "Chicago average temperature in 2017"
            scene = (Scene(root, width, height))
            show()
        }
    }

    private fun VizContainer.createChart(chicago2017: List<Weather>, cityName: String): Chart<Weather> =
        chart(chicago2017) {

            val monthDimension = discrete({ domain.month }) {
                formatter = { months[this - 1] }
            }
            val temperatureDimension = quantitative({ domain.avgTemp }) {
                name = "Avg temp for $cityName"
                formatter = { "${this.formatToInteger(Locales.en_US)} °F" }
            }

            bar(monthDimension, temperatureDimension)
        }
}
Copy this code (get the whole code by hitting "+") in a MultiChart.kt file, running the main() gives this result:
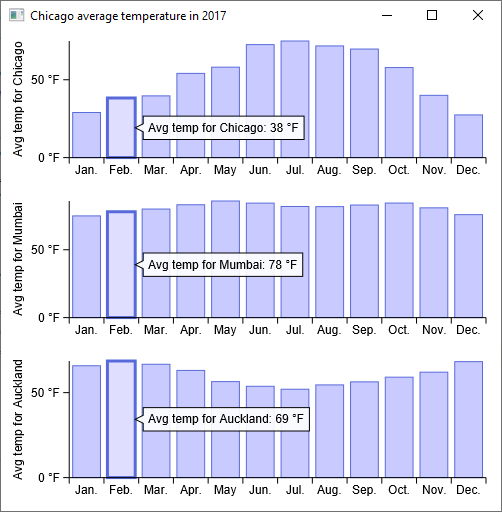
Now, synchronizing events for these 3 charts is just as easy as it seems: listen for an event on a chart and propagate it on the 2 others.
Note that you can't just "pass" the event, you have to decompose it, but all useful information is already present:
import io.data2viz.charts.chart.Chart
import io.data2viz.charts.chart.chart
import io.data2viz.charts.chart.discrete
import io.data2viz.charts.chart.mark.bar
import io.data2viz.charts.chart.quantitative
import io.data2viz.charts.core.formatToInteger
import io.data2viz.charts.event.HighlightEvent
import io.data2viz.charts.viz.VizContainer
import io.data2viz.charts.viz.newVizContainer
import io.data2viz.format.Locales
import io.data2viz.geom.Size
import javafx.application.Application
import javafx.scene.Scene
import javafx.scene.layout.Pane
import javafx.scene.layout.VBox
import javafx.stage.Stage
import java.io.File

fun main() {
    Application.launch(MultiChart::class.java)
}

private val width = 500.0
private val height = 160.0

private val months =
    listOf("Jan.", "Feb.", "Mar.", "Apr.", "May", "Jun.", "Jul.", "Aug.", "Sep.", "Oct.", "Nov.", "Dec.")

private val year = 2017

private fun loadData(cityName: String): List<Weather> {
    val csvContent = File("./src/main/resources/Weather - Stats.csv").readText()
    val weatherData = parseWeatherCSV(csvContent)
    val filteredData = weatherData.filter { weather: Weather ->
        weather.city == cityName && weather.year == year
    }
    return filteredData
}

class MultiChart : Application() {

    override fun start(stage: Stage) {

        val root = VBox()

        val citiesNames = listOf("Chicago", "Mumbai", "Auckland")
        val citiesWeather = citiesNames.map { loadData(it) }

        val chartPanes = citiesNames.map { Pane() }
        root.children.addAll(chartPanes)

        val charts = citiesNames.mapIndexed { index, cityName ->
            chartPanes[index].newVizContainer().run {
                size = Size(width, height)
                createChart(citiesWeather[index], cityName)
            }
        }

        charts.forEachIndexed { index, chart ->
            chart.onHighlight { event: HighlightEvent<Weather> ->
            if (index != 0) charts[0].highlight(event.data)
                if (index != 1) charts[1].highlight(event.data)
                if (index != 2) charts[2].highlight(event.data)
            }
        }

        // Launch our Scene
        stage.apply {
            title = "Chicago average temperature in 2017"
            scene = (Scene(root, width, height))
            show()
        }
    }

    private fun VizContainer.createChart(chicago2017: List<Weather>, cityName: String): Chart<Weather> =
        chart(chicago2017) {

            val monthDimension = discrete({ domain.month }) {
                formatter = { months[this - 1] }
            }
            val temperatureDimension = quantitative({ domain.avgTemp }) {
                name = "Avg temp for $cityName"
                formatter = { "${this.formatToInteger(Locales.en_US)} °F" }
            }

            bar(monthDimension, temperatureDimension)
        }
}
Get the whole code and paste it in your file, run the main(), you should see now that the highlight event is synchronized between the 3 charts:
Synchronizing charts based on different datasets
The previous "standard case" is pretty obvious, but you may encounter more complex setups where you need to do a bit more computation, for example when you want to synchronize 2 charts that did not share the same dataset.
However, synchronizing 2 charts means that they share at least one common value.
This implies that you can retrieve the value from the first chart, filter your second dataset to find the matching collection of items, and call the highlight() function on the second chart with it.
Synchronizing charts layouts
When you want to display synchronized charts, you often want to display them in a horizontal or a vertical layout and expect the axes to be perfectly aligned so you can compare things easily.
Charts-kt manages its own layout: it draws charts by taking into account the available space and all the constraints from the data, the formatters, the style, etc...
Let's create a new file called VerticalCharts.kt and paste this code in it:
import io.data2viz.charts.chart.Chart
import io.data2viz.charts.chart.chart
import io.data2viz.charts.chart.discrete
import io.data2viz.charts.chart.mark.bar
import io.data2viz.charts.chart.quantitative
import io.data2viz.charts.viz.VizContainer
import io.data2viz.charts.viz.newVizContainer
import io.data2viz.geom.Size
import javafx.application.Application
import javafx.scene.Scene
import javafx.scene.layout.Pane
import javafx.scene.layout.VBox
import javafx.stage.Stage
import java.io.File

fun main() {
    Application.launch(VerticalCharts::class.java)
}

private val width = 500.0
private val height = 200.0

private val months =
    listOf("Jan.", "Feb.", "Mar.", "Apr.", "May", "Jun.", "Jul.", "Aug.", "Sep.", "Oct.", "Nov.", "Dec.")

private val city = "Chicago"
private val year = 2017

private fun loadData(): List<Weather> {
    val csvContent = File("./src/main/resources/Weather - Stats.csv").readText()
    val weatherData = parseWeatherCSV(csvContent)
    val filteredData = weatherData.filter { weather: Weather ->
        weather.city == city && weather.year == year
    }
    return filteredData
}

class VerticalCharts : Application() {

    override fun start(stage: Stage) {

        val chicago2017 = loadData()

        val root = VBox()

        val chartPane1 = Pane()
        val chartPane2 = Pane()
        root.children.addAll(chartPane1, chartPane2)

        val temperatureChart = chartPane1.newVizContainer().run {
            size = Size(width, height)
                createChart(chicago2017, { avgTemp }, "Average temperature in °F")
        }

        val precipitationChart = chartPane2.newVizContainer().run {
            size = Size(width, height)
            createChart(chicago2017, { precipitation }, "Precipitations in inches")
        }

        temperatureChart.onHighlight { precipitationChart.highlight(it.data) }
        precipitationChart.onHighlight { temperatureChart.highlight(it.data) }

        // Launch our Scene
        stage.apply {
            title = "Chicago average temperature & precipitations in 2017"
            scene = (Scene(root, width, height))
            show()
        }
    }

    private fun VizContainer.createChart(chicago2017: List<Weather>, weatherValue: Weather.() -> Double, valueName: String): Chart<Weather> =
        chart(chicago2017) {

            val monthDimension = discrete({ domain.month }) {
                formatter = { months[this - 1] }
            }
            val quantitativeDimension = quantitative({ weatherValue(domain) }) {
                name = valueName
            }

            bar(monthDimension, quantitativeDimension)
        }
}
You now have 2 charts, one for the average temperature, and one for the precipitation, run the code, the result should look like this:
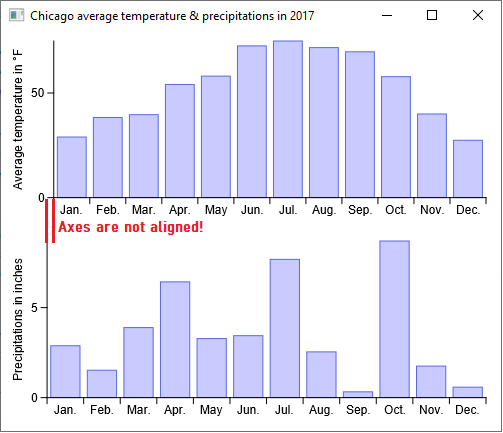
As the displayed data is different, you can see that the Y-axes labels are also different, this leads to a first Y-axis a bit wider than the second, and so, the 2 axes are not aligned.
To fix this, use a SizeManager to indicate that these 2 charts are meant to be vertically aligned:
import io.data2viz.charts.chart.Chart
import io.data2viz.charts.chart.chart
import io.data2viz.charts.chart.discrete
import io.data2viz.charts.chart.mark.bar
import io.data2viz.charts.chart.quantitative
import io.data2viz.charts.layout.sizeManager
import io.data2viz.charts.viz.VizContainer
import io.data2viz.charts.viz.newVizContainer
import io.data2viz.geom.Size
import javafx.application.Application
import javafx.scene.Scene
import javafx.scene.layout.Pane
import javafx.scene.layout.VBox
import javafx.stage.Stage
import java.io.File

fun main() {
    Application.launch(VerticalCharts::class.java)
}

private val width = 500.0
private val height = 200.0

private val months =
    listOf("Jan.", "Feb.", "Mar.", "Apr.", "May", "Jun.", "Jul.", "Aug.", "Sep.", "Oct.", "Nov.", "Dec.")

private val city = "Chicago"
private val year = 2017

private fun loadData(): List<Weather> {
    val csvContent = File("./src/main/resources/Weather - Stats.csv").readText()
    val weatherData = parseWeatherCSV(csvContent)
    val filteredData = weatherData.filter { weather: Weather ->
        weather.city == city && weather.year == year
    }
    return filteredData
}

class VerticalCharts : Application() {

    override fun start(stage: Stage) {

        val chicago2017 = loadData()

        val root = VBox()

        val chartPane1 = Pane()
        val chartPane2 = Pane()
        root.children.addAll(chartPane1, chartPane2)

        val temperatureChart = chartPane1.newVizContainer().run {
            size = Size(width, height)
                createChart(chicago2017, { avgTemp }, "Average temperature in °F")
        }

        val precipitationChart = chartPane2.newVizContainer().run {
            size = Size(width, height)
            createChart(chicago2017, { precipitation }, "Precipitations in inches")
        }

        temperatureChart.onHighlight { precipitationChart.highlight(it.data) }
        precipitationChart.onHighlight { temperatureChart.highlight(it.data) }

        val verticalSynchronizer = sizeManager().vSynchro()
        verticalSynchronizer.addAllCharts(temperatureChart, precipitationChart)

        // Launch our Scene
        stage.apply {
            title = "Chicago average temperature & precipitations in 2017"
            scene = (Scene(root, width, height))
            show()
        }
    }

    private fun VizContainer.createChart(chicago2017: List<Weather>, weatherValue: Weather.() -> Double, valueName: String): Chart<Weather> =
        chart(chicago2017) {

            val monthDimension = discrete({ domain.month }) {
                formatter = { months[this - 1] }
            }
            val quantitativeDimension = quantitative({ weatherValue(domain) }) {
                name = valueName
            }

            bar(monthDimension, quantitativeDimension)
        }
}
Run the main() and check the result, as you can see the charts now use the expected layout:
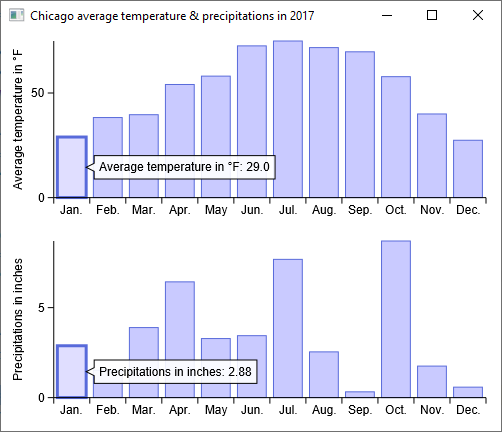
Find more information about chart's layout management in this guide.