Creating your first Kotlin JS chart app, part 2
In this second tutorial, you'll see some of the basic features of Charts-kt, and build a bar chart based on your data model.
This tutorial will help you understand how to:
- Parse and map a CSV file to a Kotlin data class
- Use your own model and data in your charts
- Describe your values through "dimensions"
- Create a bar chart
- Understand the "Datum" concept
What do you need?
- 15 minutes
- A working Kotlin JS environment (see part 1)
- Intellij Community or Ultimate (tested with IntelliJ 2020.3.*)
Parsing a CSV file
This Google Spreadsheet CSV export contains statistical weather data for each month of 2016 and 2017, for 5 different cities.
Parsing this file is very easy using the multiplatform Dsv module of data2viz.
- create a Kotlin data class
Weatherto hold the information, - load the file asynchronously using a
Promise, - parse each row and, if needed, drop the header (the first line of the file),
- finally, map each row of the file in a
Weatherinstance.
import io.data2viz.dsv.Dsv
import kotlinx.browser.window
import kotlinx.html.div
import kotlinx.html.dom.append
import org.w3c.dom.Node
import org.w3c.fetch.Response
import kotlin.js.Promise
private val fileName =
"https://docs.google.com/spreadsheets/d/e/2PACX-1vTX4QuCNyDvUo" +
"Awk6Jl6UJ4r336A87VIKQ5BVyEgowXG_raXdFBMvmUhmz1LLc07Ga" +
"vyC9J6pZ4YHqJ/pub?gid=650761999&single=true&output=csv"
fun Node.loadCSV() {
val request: Promise<Response> = window.fetch(fileName)
request.then { response ->
response.text().then { csvContent ->
val weatherData = parseWeatherCSV(csvContent)
append {
div {
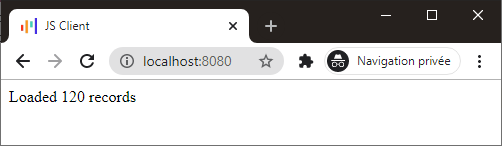
+"Loaded ${weatherData.size} records"
}
}
}
}
}
data class Weather(
val city: String,
val year: Int,
val month: Int,
val highTemp: Double,
val avgTemp: Double,
val lowTemp: Double,
val precipitation: Double
)
fun parseWeatherCSV(csvContent: String): List<Weather> = Dsv()
.parseRows(csvContent)
.drop(1)
.map { row ->
Weather(
row[0],
row[1].toInt(),
row[2].toInt(),
row[3].toDouble(),
row[4].toDouble(),
row[5].toDouble(),
row[6].toDouble()
)
}
The Kotlin data class offers a very convenient way to hold your information loaded from your CSV file.
Copy this code in a LoadCSV.kt file.
Change, in the client.kt file, the code to call your loadCSV() function, save and refresh your page, you should see this result:
Using a strongly typed data model
Kotlin is a strongly typed language that helps your writing code via auto-completion and compilation time checking.
This feature helps you when managing your data and building your chart.
Preparing the dataset with Kotlin built-in functions
Let's have a look at the weather in Chicago for 2017.
To filter the dataset, use the built-in filter function of Kotlin:
// (....)
val weatherData = parseWeatherCSV(csvContent)
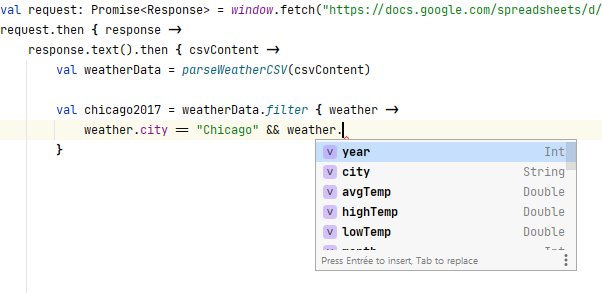
val chicago2017 = weatherData.filter { weather ->
weather.city == "Chicago" && weather.year == 2017
}
Here, the filter lambda takes a Weather parameter, so your IDE can provide auto-completion, as you can see:
Also benefit from strong-typing in your chart
The same applies to the Chart you create with Charts-kt: by giving it your dataset on instantiation, your chart will be typed with your data, here the Weather class.
This Weather class will be referred as the DOMAIN.
Think of it as a generic class <DOMAIN>, so using it in your chart will create a typed instance: Chart<Weather>.
Copy and paste this whole code in a new Kotlin file named WeatherChart.kt in your kotlin directory:
import io.data2viz.charts.chart.chart
import io.data2viz.charts.chart.discrete
import io.data2viz.charts.chart.mark.bar
import io.data2viz.charts.chart.quantitative
import io.data2viz.charts.viz.newVizContainer
import io.data2viz.geom.Size
import kotlinx.browser.window
import kotlinx.html.div
import kotlinx.html.dom.append
import org.w3c.dom.Node
import org.w3c.fetch.Response
import kotlin.js.Promise

private val width = 500.0
private val height = 400.0

private val fileName =
    "https://docs.google.com/spreadsheets/d/e/2PACX-1vTX4QuCNyDvUo" +
            "Awk6Jl6UJ4r336A87VIKQ5BVyEgowXG_raXdFBMvmUhmz1LLc07Ga" +
            "vyC9J6pZ4YHqJ/pub?gid=650761999&single=true&output=csv"

fun Node.createChart() {

    val request: Promise<Response> =
        window.fetch(fileName)

    request.then { response ->
        response.text().then { csvContent ->
            val weatherData = parseWeatherCSV(csvContent)
            val chicago2017 = weatherData.filter {
                it.city == "Chicago" && it.year == 2017
            }

            append {
                div {
                    val vc = newVizContainer().apply {
                        size = Size(width, height)
                    }
                    vc.chart(chicago2017) {

                        val monthDimension = discrete({ domain.month })
                        val temperatureDimension = quantitative({ domain.avgTemp })

                        bar(monthDimension, temperatureDimension)
                    }
                }
            }
        }
    }
}
Note that your
Chartinstance is typed as aChart<Weather>.
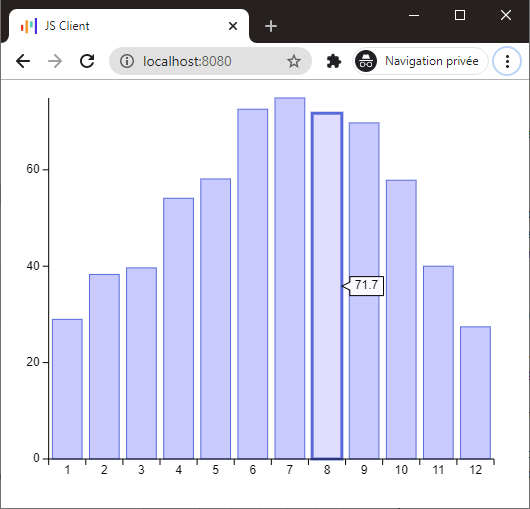
Once again, call your createChart() function from your client.kt file and refresh to see this:
The dimensions: how to describe our dataset
When you look at the code, you can see that you create 2 dimensions: monthDimension and temperatureDimension and use them in your chart:
import io.data2viz.charts.chart.chart
import io.data2viz.charts.chart.discrete
import io.data2viz.charts.chart.mark.bar
import io.data2viz.charts.chart.quantitative
import io.data2viz.charts.viz.newVizContainer
import io.data2viz.geom.Size
import kotlinx.browser.window
import kotlinx.html.div
import kotlinx.html.dom.append
import org.w3c.dom.Node
import org.w3c.fetch.Response
import kotlin.js.Promise

private val width = 500.0
private val height = 400.0

private val fileName =
    "https://docs.google.com/spreadsheets/d/e/2PACX-1vTX4QuCNyDvUo" +
            "Awk6Jl6UJ4r336A87VIKQ5BVyEgowXG_raXdFBMvmUhmz1LLc07Ga" +
            "vyC9J6pZ4YHqJ/pub?gid=650761999&single=true&output=csv"

fun Node.createChart() {

    val request: Promise<Response> =
        window.fetch(fileName)

    request.then { response ->
        response.text().then { csvContent ->
            val weatherData = parseWeatherCSV(csvContent)
            val chicago2017 = weatherData.filter {
                it.city == "Chicago" && it.year == 2017
            }

            append {
                div {
                    val vc = newVizContainer().apply {
                        size = Size(width, height)
                    }
                    vc.chart(chicago2017) {

                        val monthDimension = discrete({ domain.month })
                        val temperatureDimension = quantitative({ domain.avgTemp })

                        bar(monthDimension, temperatureDimension)
                    }
                }
            }
        }
    }
}
A dimension is a way to describe how to acccess the data and how to process the data.
The dimension type (how to process the data)
In the Weather class, the month is stored as an Int and the average temperature as a Double, and, as you want to draw a bar chart, you want to process them differently:
- Temperature is a continuous numeric value, use the
quantitativedimension to express that - Month is a discrete value, use the
discretedimension to process it as a "category"
The dimension accessor (how to access the data)
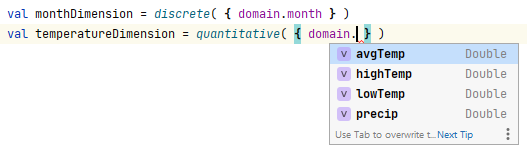
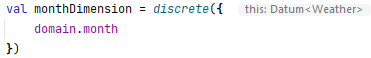
Each Dimension applies to a DOMAIN instance. Here it's your Weather object and you need to indicates which property you want to translate as your dimension.
This is what is done in the lambda inside the parenthesis, the domain value refers to your Weather object, so the monthDimension is based on the domain.month property, and the temperatureDimension on the domain.avgTemp one.
We call this lambda the "accessor", it describes how to access the data.
Here again, the strong-typing offers some help with the editor.
Note how a Quantitative dimension only accepts some Double values when using smart-completion with IDEA:
Adding some information on dimensions
You can add some properties on dimensions like name and formatter.
Let's add a title to your chart, and add these properties on your dimension, replace the code of WeatherChart.kt with the following:
import io.data2viz.charts.chart.chart
import io.data2viz.charts.chart.discrete
import io.data2viz.charts.chart.mark.bar
import io.data2viz.charts.chart.quantitative
import io.data2viz.charts.core.formatToInteger
import io.data2viz.charts.viz.newVizContainer
import io.data2viz.format.Locales
import io.data2viz.geom.Size
import kotlinx.browser.window
import kotlinx.html.div
import kotlinx.html.dom.append
import org.w3c.dom.Node
import org.w3c.fetch.Response
import kotlin.js.Promise

private val width = 500.0
private val height = 400.0

private val months = listOf("Jan.", "Feb.", "Mar.", "Apr.", "May", "Jun.", "Jul.", "Aug.", "Sep.", "Oct.", "Nov.", "Dec.")
private val city = "Chicago"
private val year = 2017

private val fileName =
    "https://docs.google.com/spreadsheets/d/e/2PACX-1vTX4QuCNyDvUo" +
            "Awk6Jl6UJ4r336A87VIKQ5BVyEgowXG_raXdFBMvmUhmz1LLc07Ga" +
            "vyC9J6pZ4YHqJ/pub?gid=650761999&single=true&output=csv"

fun Node.createChart() {

    val request: Promise<Response> =
        window.fetch(fileName)

    request.then { response ->
        response.text().then { csvContent ->
            val weatherData = parseWeatherCSV(csvContent)
            val chicago2017 = weatherData.filter {
                it.city == city && it.year == year
            }

            append {
                div {
                    val vc = newVizContainer().apply {
                        size = Size(width, height)
                    }
                    vc.chart(chicago2017) {

                        title = "Monthly average temperature in $city, $year"

                        val monthDimension = discrete( { domain.month } ) {
                            formatter = { months[this-1] }
                        }
                        val temperatureDimension = quantitative( { domain.avgTemp } ) {
                            name = "Average temperature"
                            formatter = { "${this.formatToInteger(Locales.en_US)} °F" }
                        }

                        bar(monthDimension, temperatureDimension)
                    }
                }
            }
        }
    }
}
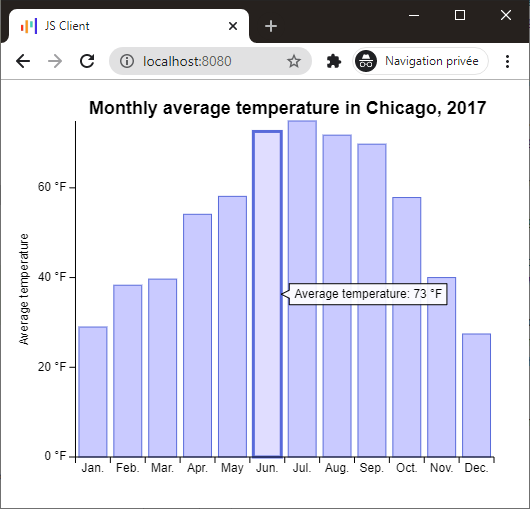
Run the code and you can see that, giving your dimension a name automatically add a title to your corresponding axis (the Y-axis).
Also the data that is computed through your dimension will be formatted with the given formatter (check the Y-axis and the tooltip):
The "Datum", a convenient way to access data
Maybe you already see that the Dimension did not directly use a DOMAIN parameter, but instead a Datum<DOMAIN>, here a Datum<Weather>:
A Datum is an object that holds your domain object (as its domain property), but also some other useful information like the index of your current object in the dataset...
For now, just keep in mind that you don't manipulate the DOMAIN object directly, the Datum will prove itself very useful on many occasions.