Series and stacking
The "series" is a specific discrete dimension that is used to split your dataset into several subsets you want to identify in your chart.
The term "series" is also used to refer to these subsets of data.
What's a "series"?
By default, all your domain objects will belong to the same series, but you can define a property on which you want to split them, and they will be handled as different collections.
The series dimension is a property of your chart and it applies to every mark:
chart(weatherData) {

		(...)

    series = discrete({ domain.city })
}
Think of this as a Kotlin groupBy function:
weatherData.groupBy { it.city }
Let's say that you load a CSV file containing weather readings for different cities. You may choose to filter this dataset yourself and use it in different charts, one for each city.
But you may also want to use series to display all cities weather readings in a single chart:
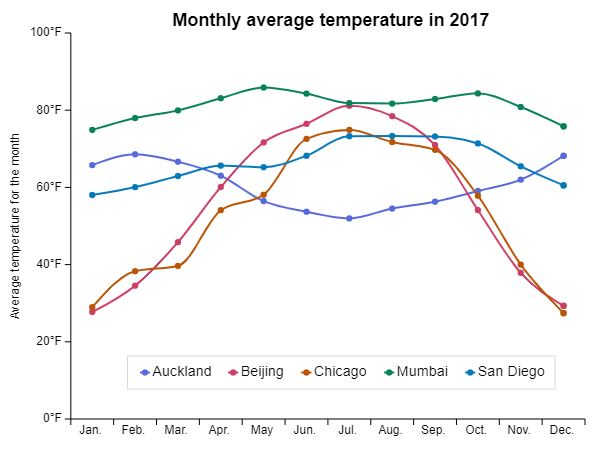
Series and stacking
Each series is considered as a whole dataset and is displayed separately (if the mark can handle multiple series) but in the same "charting space", meaning they share the same axes.
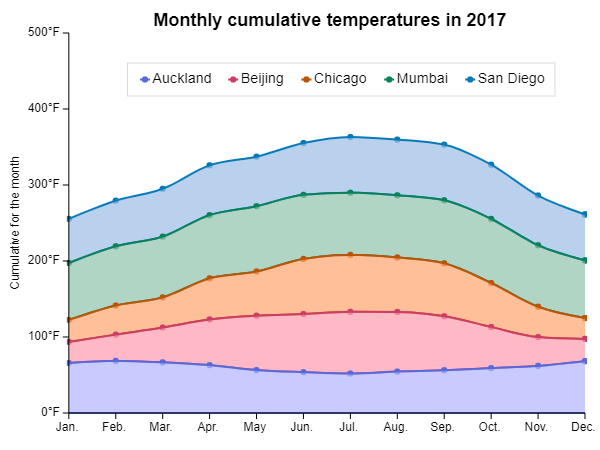
But you can also indicate a stacking behavior, then each series will be displayed relatively to the others as in this example:
chart(weatherData) {

	(...)

	val monthDim = discrete( { domain.month } )

    val tempDim = quantitative( { domain.avgTemp } ) {
        name = "Cumulative for the month"
        formatter = { "$this°F" }
    }

		series = discrete( { domain.city } )

	area(monthDim, tempDim) {
			stacking = Stacking.Standard
	}
}