Creating your first Android chart app, part 1
Let's see step-by-step how to integrate Charts-kt in an Android application.
In this tutorial you will :
- Create a minimal android application with one activity
- Configure your build to import the needed libraries
- Create your first chart
What do you need?
- 15 minutes
- JDK 1.8 (or later)
- Android Studio or Intellij Idea with Android plugin activated (tested with Android Studio 4.1.3)
Creating the Android project
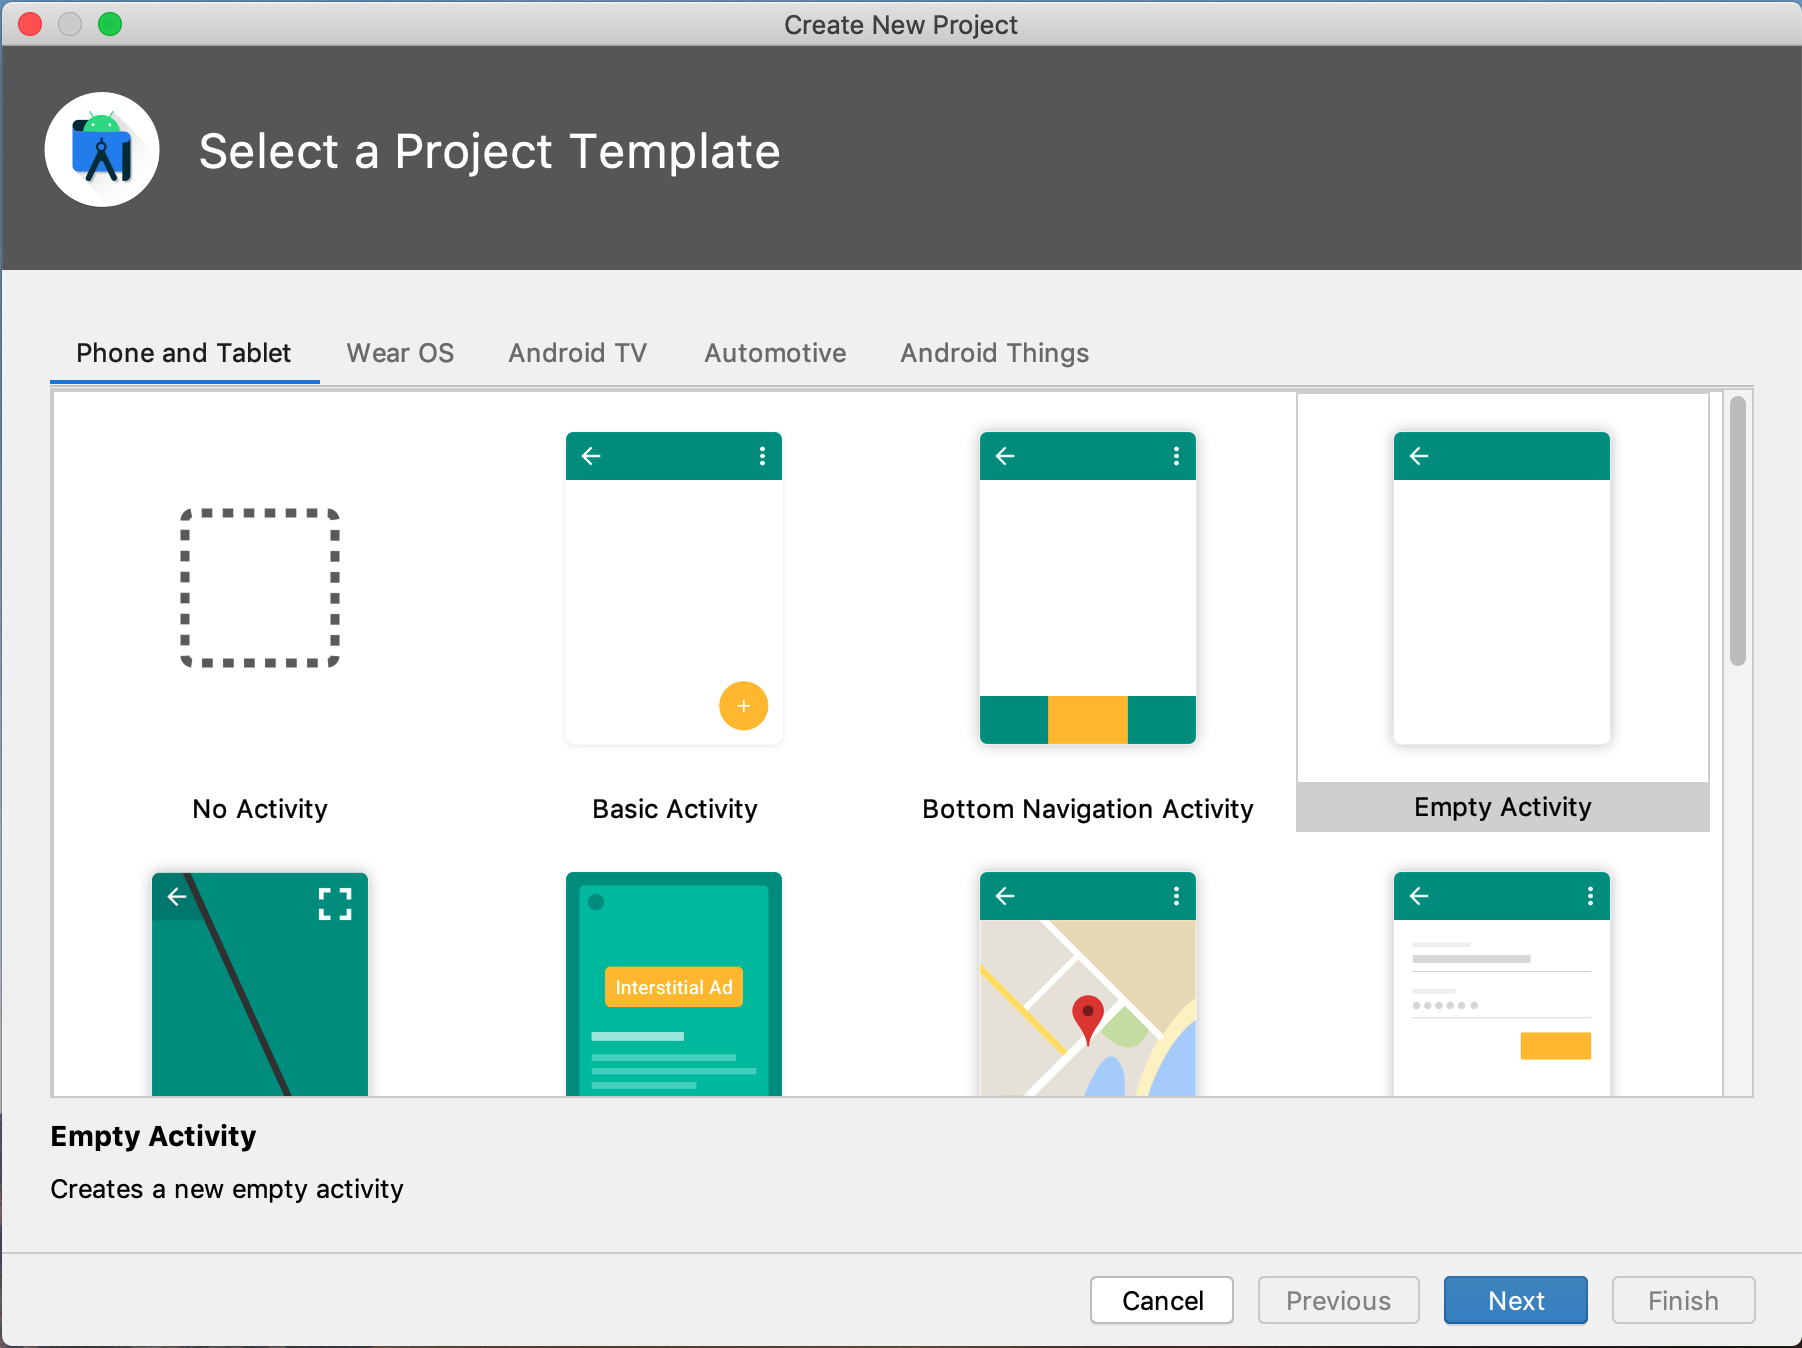
From Android Studio (or Intellij idea), start by select create new project and choose Empty Activity.
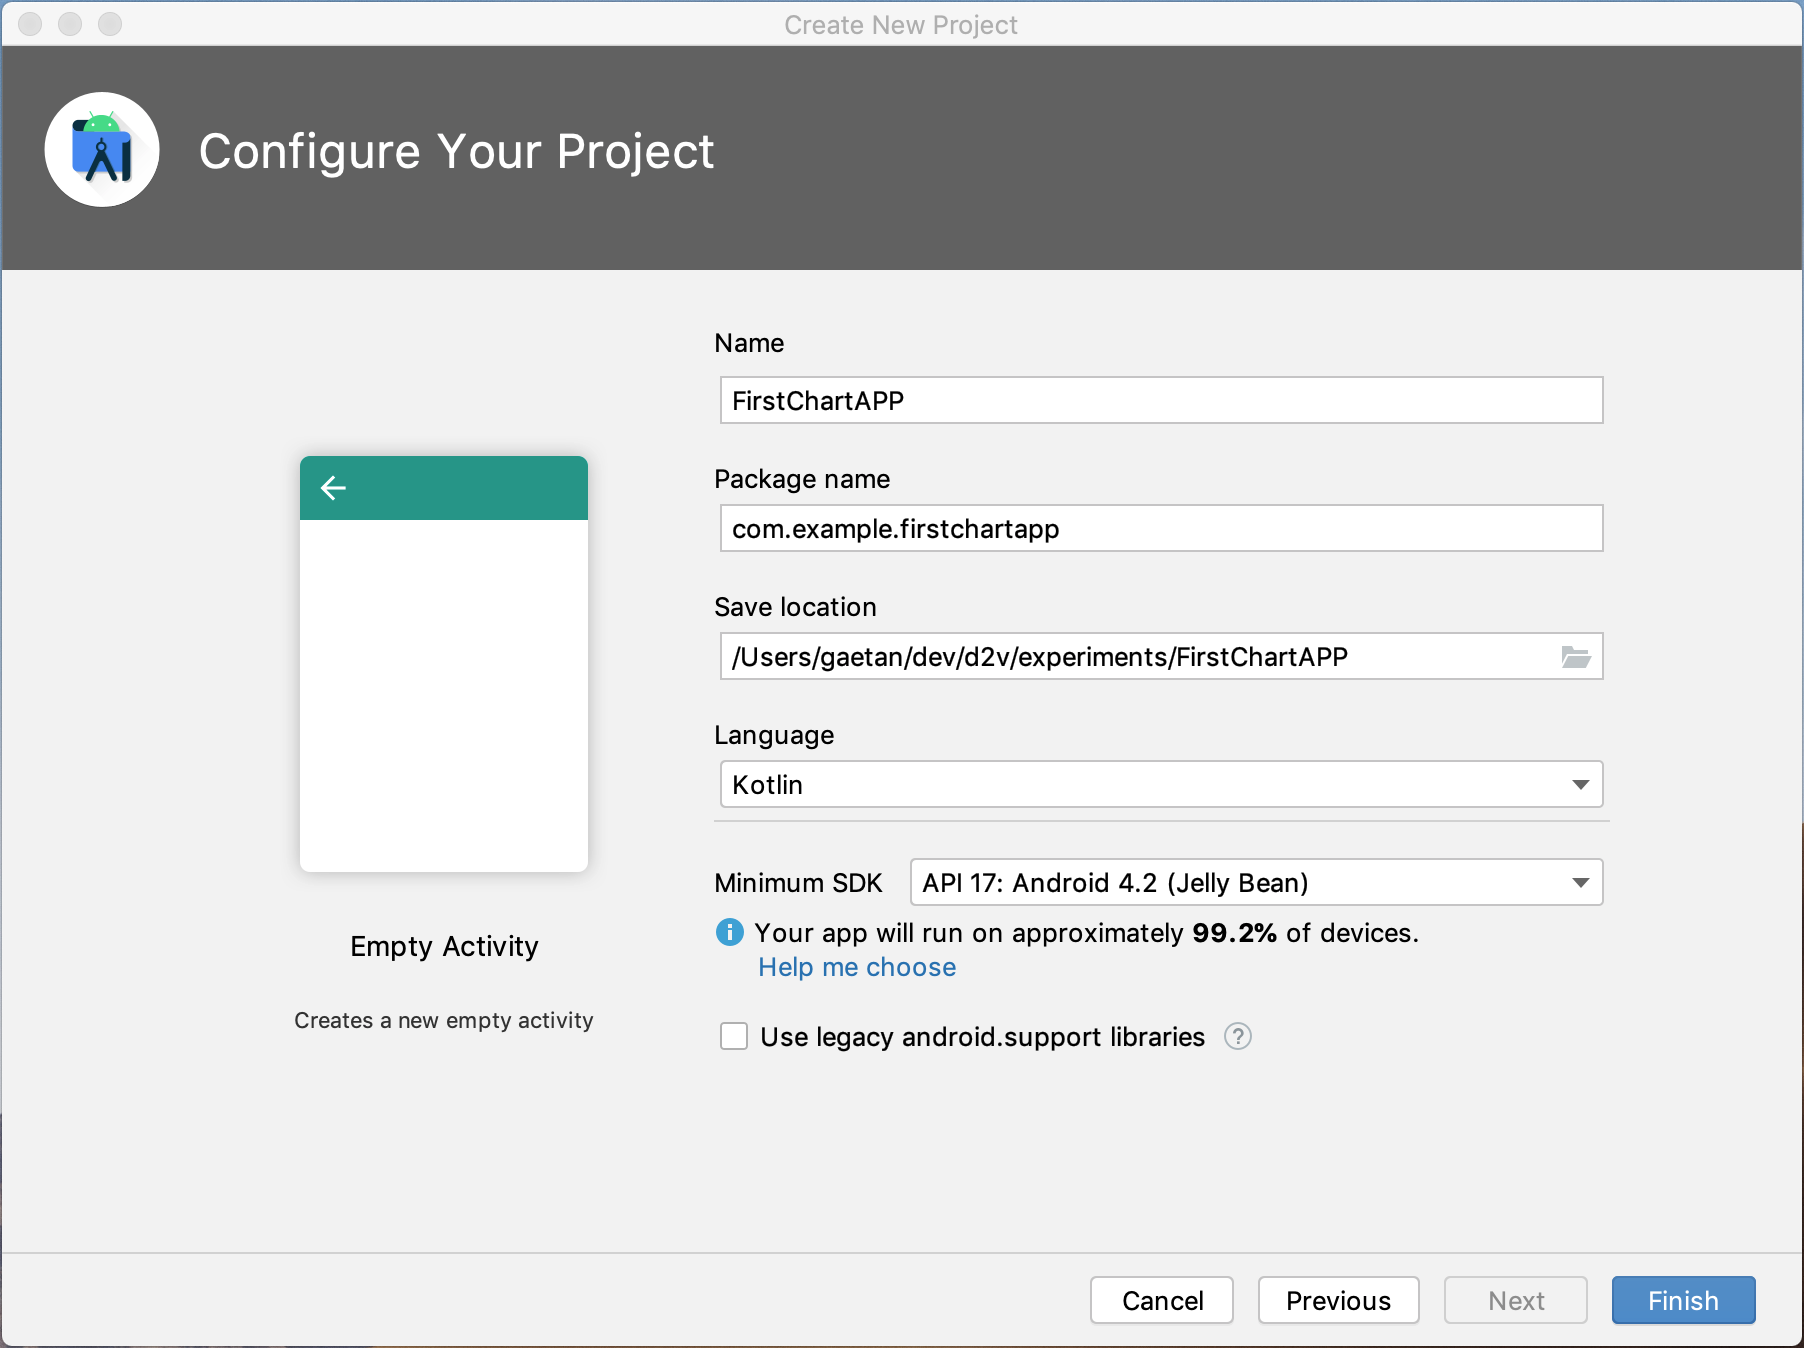
Click next, give a name and choose the minimum SDK you want to use for your app.
In our case, we choose API 17 to have a charts application compatible with more than 99% of devices (it's also the minimum version allowed for Charts.kt).
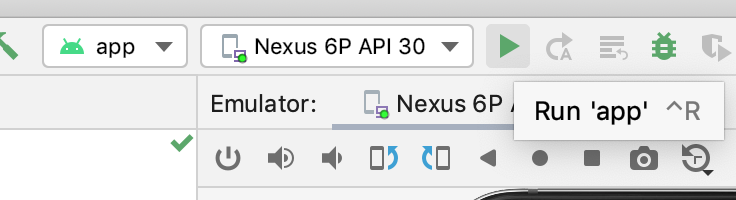
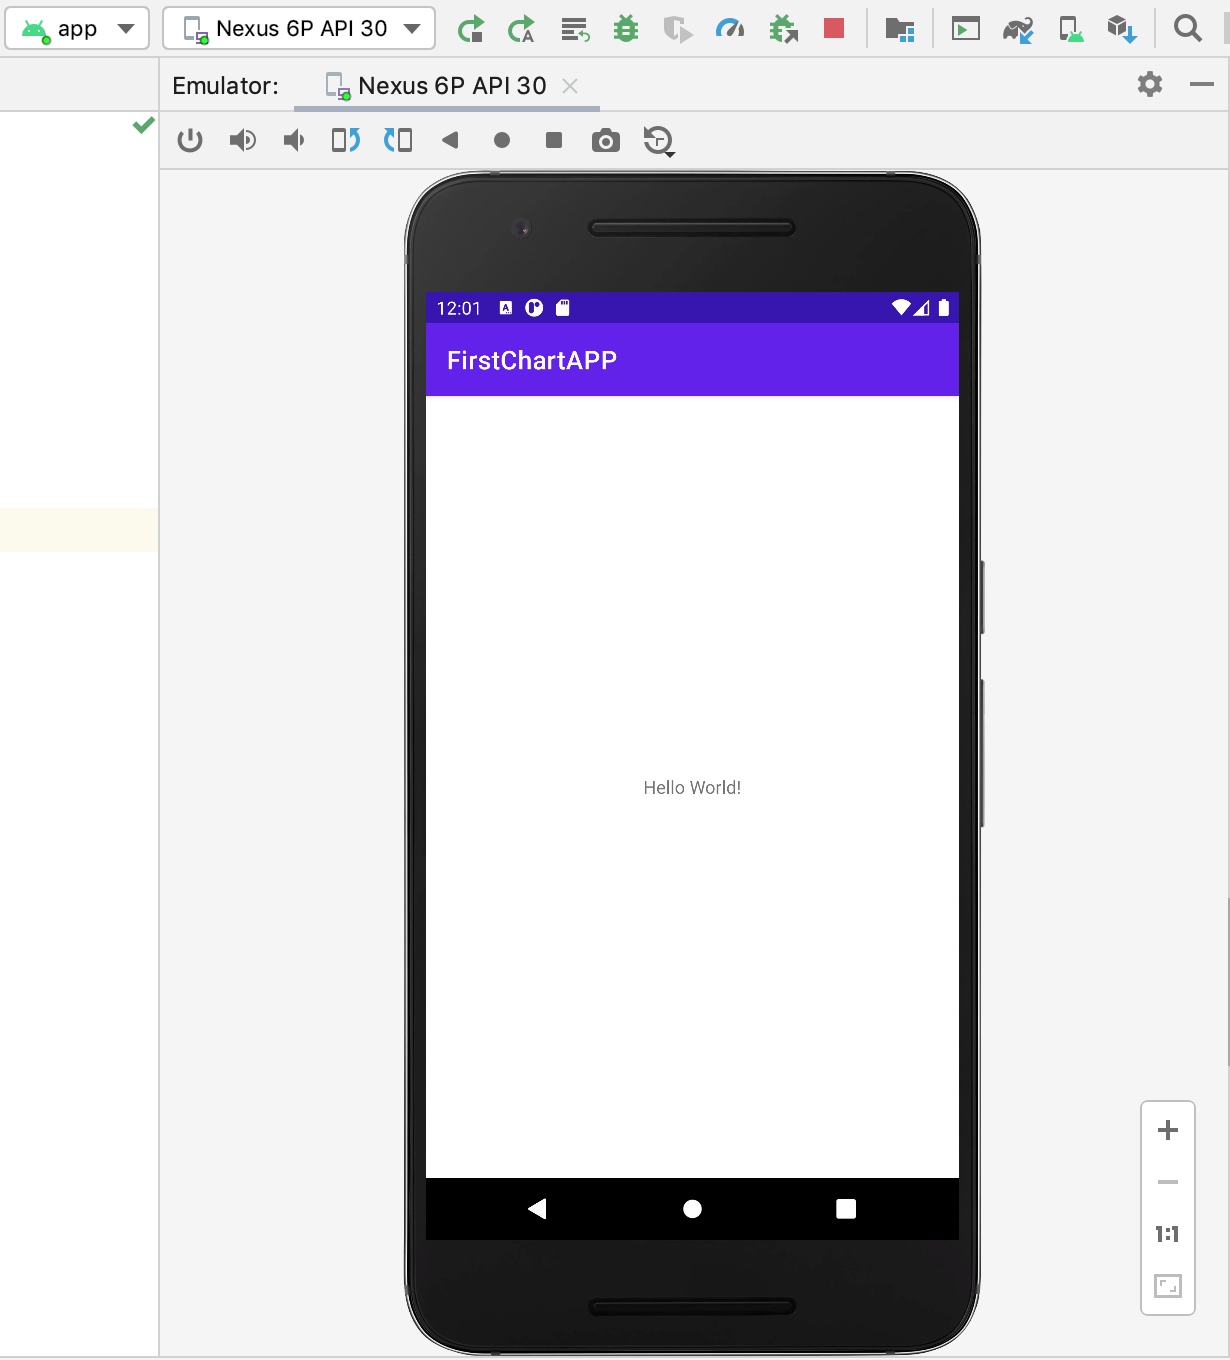
Click Finish and wait for the ide to finish the synchronization of the project. Validate your project by running the application in the emulator.
You should see the resulting Hello World
Importing the libraries
First, edit the build.gradle file at the root of the project to add the following maven repositories.
allprojects{
  repositories{
    google()
    maven{
      url "https://maven.pkg.jetbrains.space/data2viz/p/maven/dev"
    }
    maven{
      url "https://maven.pkg.jetbrains.space/data2viz/p/maven/public"
    }
  }
}
Next, edit the build.gradle file of the module to add the following dependencies:
dependencies{
  implementation 'io.data2viz.charts:core:1.1.0-eap1'
  implementation 'io.data2viz.d2v:viz:0.8.12'
  coreLibraryDesugaring 'com.android.tools:desugar_jdk_libs:1.1.5'
...
You also need to add the following parameter in the defaultConfig section:
// Required when setting minSdkVersion to 20 or lower
multiDexEnabled true
Relaunch the application to validate your new settings.
Create the chart view
Now you are going to add the code that contains your first chart.
The code is a view. You can copy the following code directly in the MainActity.kt file (click on the "+" button to see the whole file):
package com.example.firstchartapp
import android.content.Context
import android.os.Bundle
import androidx.appcompat.app.AppCompatActivity
import io.data2viz.charts.chart.Chart
import io.data2viz.charts.chart.chart
import io.data2viz.charts.chart.discrete
import io.data2viz.charts.chart.mark.area
import io.data2viz.charts.chart.quantitative
import io.data2viz.geom.Size
import io.data2viz.viz.VizContainerView
class MainActivity : AppCompatActivity() {
override fun onCreate(savedInstanceState: Bundle?) {
super.onCreate(savedInstanceState)
setContentView(CanadaChart(this))
}
}
class CanadaChart(context: Context) : VizContainerView(context) {
private val chart: Chart<PopCount> = chart(canPop) {
size = Size(vizSize, vizSize)
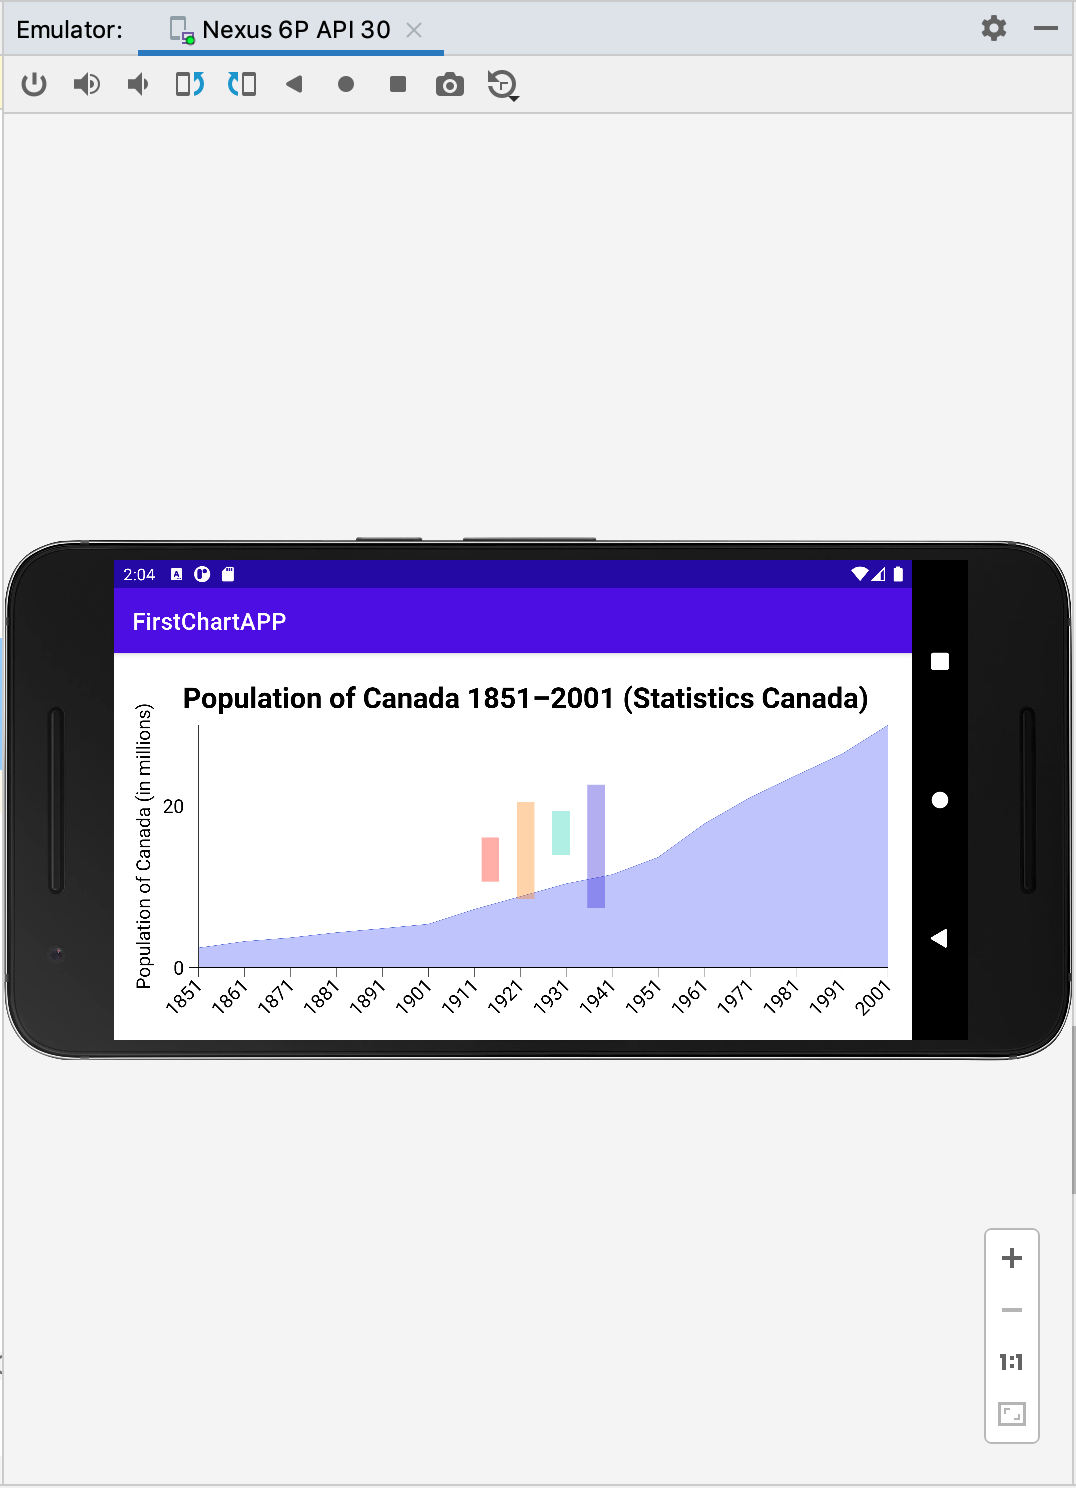
title = "Population of Canada 1851–2001 (Statistics Canada)"
// Create a discrete dimension for the year of the census
val year = discrete({ domain.year })
// Create a continuous numeric dimension for the population
val population = quantitative({ domain.population }) {
name = "Population of Canada (in millions)"
}
// Using a discrete dimension for the X-axis and a continuous one for the Y-axis
area(year, population)
}
override fun onSizeChanged(w: Int, h: Int, oldw: Int, oldh: Int) {
super.onSizeChanged(w, h, oldw, oldh)
chart.size = Size(vizSize, vizSize * h / w)
}
}
const val vizSize = 500.0
data class PopCount(val year: Int, val population: Double)
val canPop = listOf(
PopCount(1851, 2.436),
PopCount(1861, 3.23),
PopCount(1871, 3.689),
PopCount(1881, 4.325),
PopCount(1891, 4.833),
PopCount(1901, 5.371),
PopCount(1911, 7.207),
PopCount(1921, 8.788),
PopCount(1931, 10.377),
PopCount(1941, 11.507),
PopCount(1951, 13.648),
PopCount(1961, 17.78),
PopCount(1971, 21.046),
PopCount(1981, 23.774),
PopCount(1991, 26.429),
PopCount(2001, 30.007)
)
Note that you may need to synchronize your IDE to take the last modification of the gradle files:
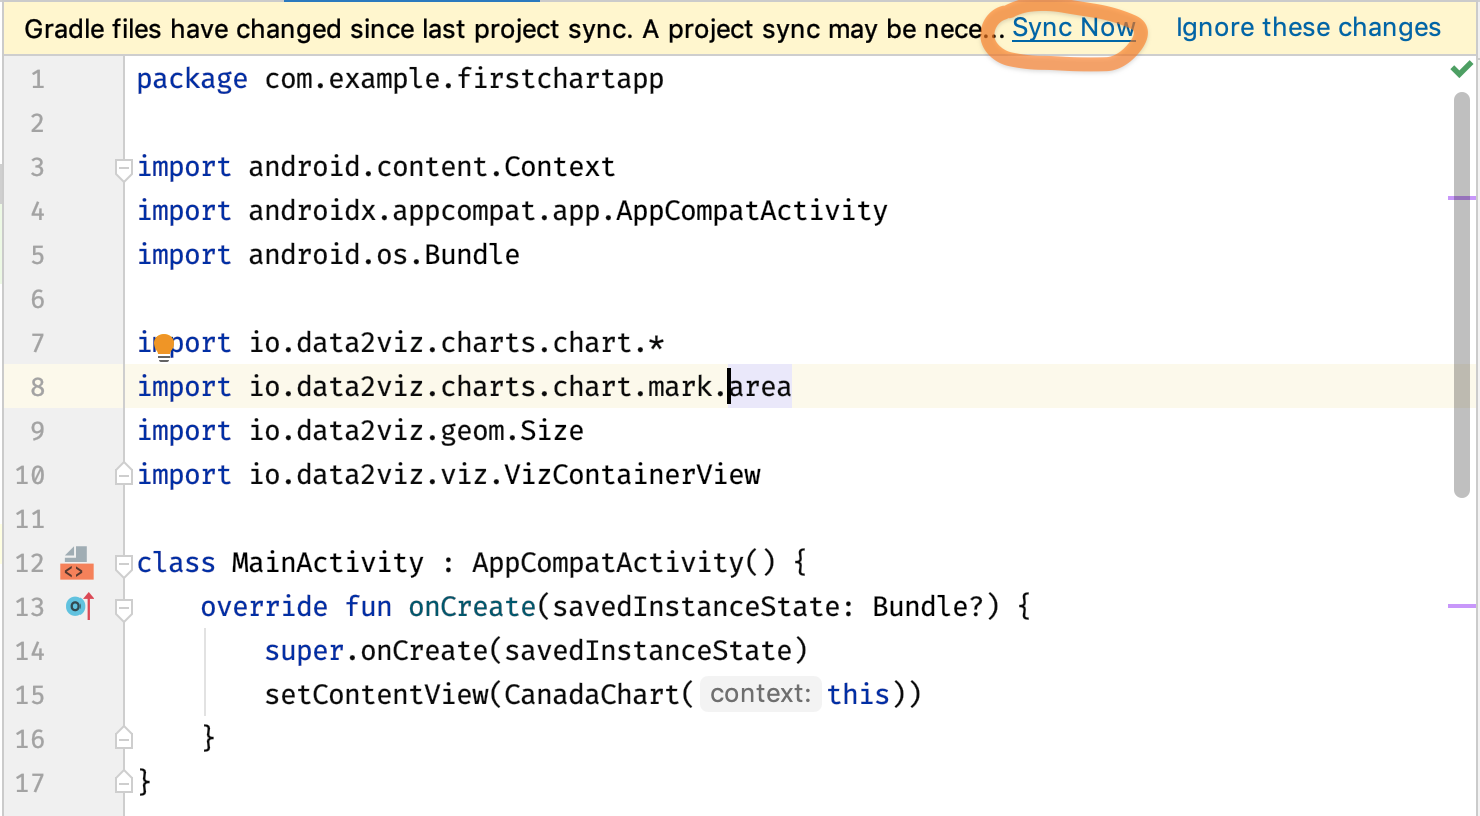
You now have to replace the content view of the activity by the chart's view.
override fun onCreate(savedInstanceState: Bundle?) {
    super.onCreate(savedInstanceState)
    setContentView(CanadaChart(this))
}
Relaunch your application and you should now view the chart.
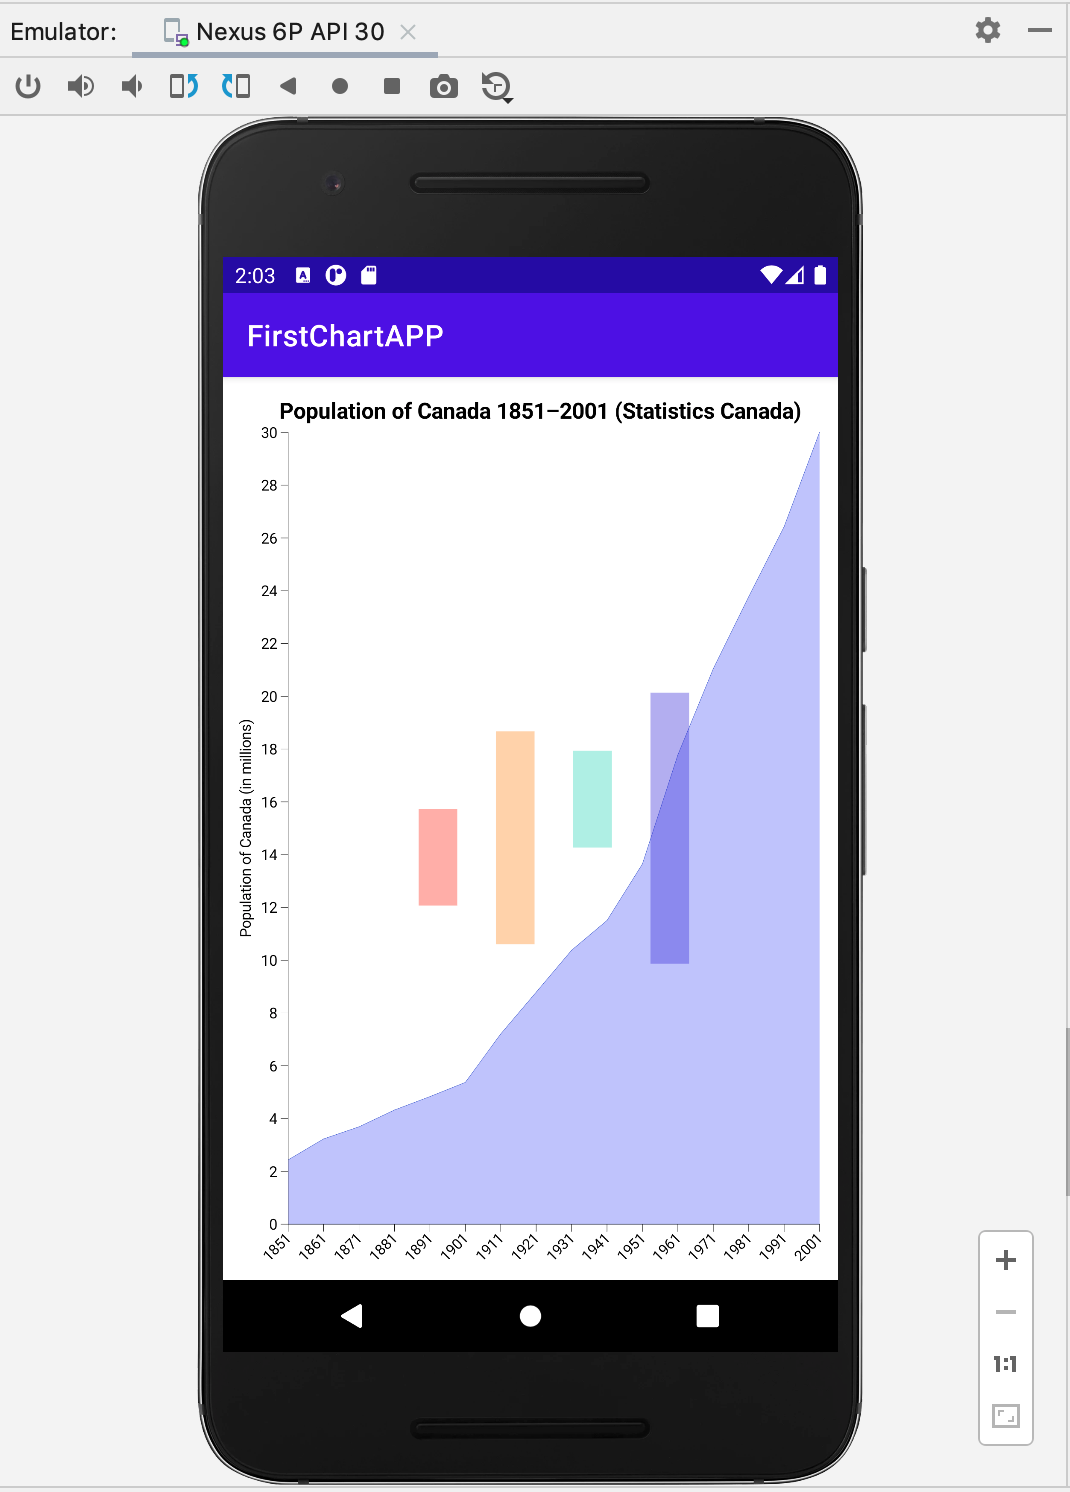
Notice the chart and axes updates when you change the phone's orientation.