Zoom & Pan
Charts-kt manages zooming and panning of the visuals.
This is not a "GPU" transformation: it's not just the visuals that are zoomed or panned, but the whole chart that is refreshed, and everything is recomputed.
Enabling zoom and pan
To enable zoom and pan you have access to these properties of a the chart config:
chart(data) {

	config {
		events {
	    zoomMode = ZoomMode.XY              // enable zooming on X and Y directions
	    panMode = PanMode.None              // disable panning
		}
	}

	(...)
}
Note that this enables or disables user interactions, however, you can always "force" them by code with chart.zoom() or chart.pan().
The chart's zoom information
Your Chart contains a public Zoom instance that holds your "zoom information".
Zoom ratio
This Zoom contains 2 DirectedZoom classes, one for each direction, and each of these classes stores the ratio and the offset of your zoom.
The more you zoom-in, the higher your ratio, a chart.zoom.xZoom.ratio of 2.0 for example means that your actual chart X-axis is two times larger than the initial one.
Zoom offset
When you move your chart around, the offset is updated to reflect this panning.
But when you zoom in and out, the offset is also updated so the visual elements you are zooming on stay on screen just where you expect them to be.
The zoom event
The ZoomEvent data class contains all changes that reflect a zooming action.
The zoom origin (zoomOriginX, zoomOriginY) is relative to the main charting zone:
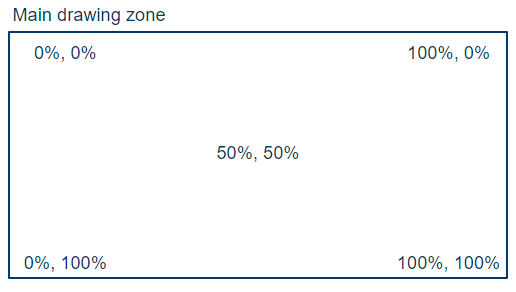
For example if you zoom-in at the top-right corner the zoomOriginX value is 100% and the
zoomOriginY value is 0%.
The zoom factor (zoomFactorX, zoomFactorY) is also relative, it indicates the increase or decrease of your zooming ratio in both directions.
If you zoom-in in both direction the zoom factor will be > 100%, if you zoom-out it will be < 100%.
The zoom event uses relative values, allowing for easier translation of a zoom event from one chart to another chart, even if these charts do not have the same sizes.
Note that the vertical zoom is directed from top to bottom, so zooming at the bottom of your chart will provide a Y coordinates of 100%. This is the standard behavior with screen coordinates.
Hooking on zoom and pan
Most of the time, you won't have to dive into this level of detail because Charts-kt handles it for you. The standard marks all work with zoom and pan and produce the expected behavior.
However, you may place your charts in a complete application and perhaps want to handle zooming yourself cause you've got 2 buttons "zoom-in" and "zoom-out", or you may want to synchronize zoom and pan between several charts.
Listening to zoom and pan
To hook onto these events, just add some listeners to your Chart:
myChart.onZoom { zoomEvent ->
	println(zoomEvent)
}

myChart.onPan { panEvent ->
	println(panEvent)
}
Forcing zoom and pan
Your main Chart can also handle zoom and pan values, just call the appropriate functions:
// zoom-in on X-axis only, from the left most coordinate
myChart.zoom(0.pct, 0.pct, 120.pct, 100.pct)

// pan on Y-axis only by 50% of the actual viewport (main charting zone) height
myChart.pan(0.pct, 50.pct)
As explained before, even if you have disabled user-interactive zoom & pan in your chart, these calls will zoom & pan your chart.