Creating your first Kotlin JS chart app, part 1
Let's see step-by-step how to create a Kotlin JS application that uses Charts-kt.
This tutorial will help you understand how to:
- Set up a Kotlin Javascript project
- Import the libraries you need using your licence keys
- Create your first chart and launch it
What do you need?
- 15 minutes
- JDK 1.8 (or later)
- Intellij Community or Ultimate (tested with IntelliJ 2020.3.*)
Creating the Kotlin JS project
IntelliJ IDEA is the editor of choice for a Kotlin project. This tutorial works with the community (free) edition of IDEA as well as the ultimate edition.
Let's start by creating a new Kotlin project, and choose Browser Application.
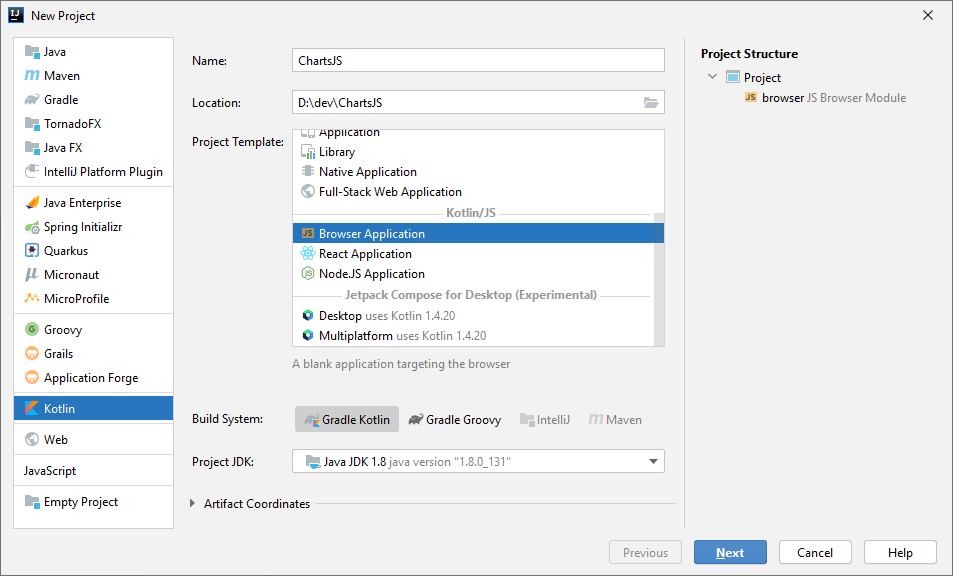
Choose the name and location of your project.
As for the build system, Gradle is the preferred option but Maven also works.
We'll choose Gradle Kotlin for this tutorial, you can change it if you're more comfortable with Groovy.
Choose Java 8 or later as your project JDK.
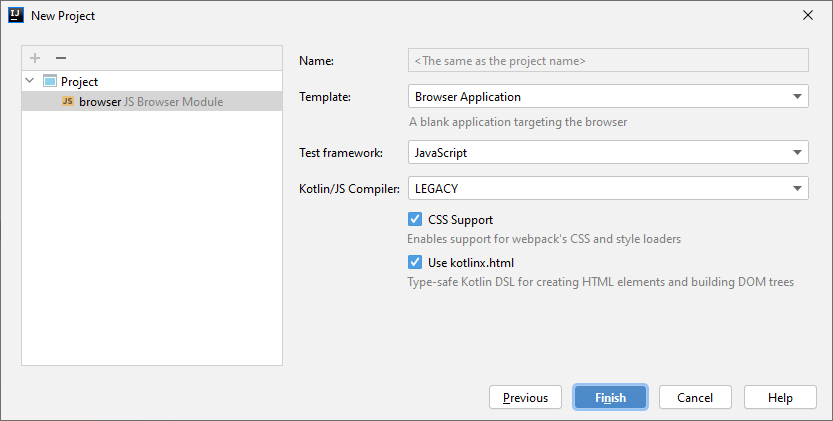
For this tutorial we'll also use kotlinx.html, a convenient DSL to create HTML elements, so check the box:
Checking the project
Finish the project creation wizard, you should have a client.kt file and an index.html.
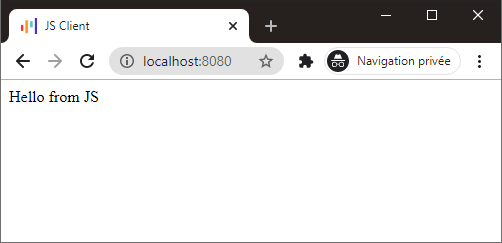
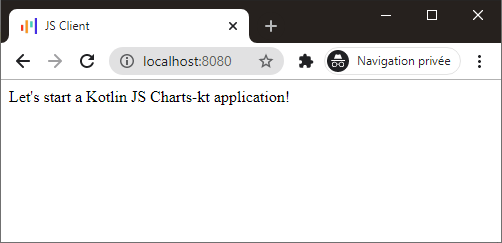
You also should have 2 run configurations available: BrowserDevelopmentRun and BrowserProductionRun. Run the first one, you should get this result:
Note that these configurations are launched in continuous mode (with the --continuous argument), so making a change and saving will reload the app.
Simply change the text in the client.kt file, you should see the result updated immediately:
Importing the libraries
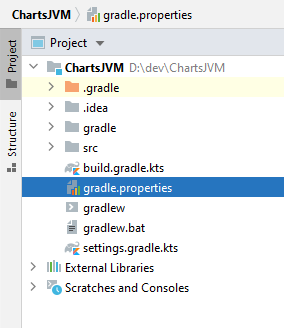
First, let's add in the gradle.properties file of the project, two properties for the versioning of our libraries:
// choose the last stable versions!
d2vVersion=0.10.4
chartsVersion=1.0.12-RC2
The EAP version of charts is for development use only and displays a watermark on every chart but it did not require any license.
Then add this code in the build.gradle.kts file at the root of your project to specify the repositories, credentials, and versions used.
val d2vVersion: String by project
val chartsVersion: String by project

repositories {
    maven{
        url = uri("https://maven.pkg.jetbrains.space/data2viz/p/maven/dev")
    }
    maven{
        url = uri("https://maven.pkg.jetbrains.space/data2viz/p/maven/public")
    }
    mavenCentral()
}

dependencies {
    implementation ("io.data2viz.d2v:d2v-core-js:$d2vVersion")
    implementation ("io.data2viz.charts:core:$chartsVersion")
}
Note that you're importing the charts-kt library, but also the core module of the data2viz open-source library which contains a lot of basic stuff you'll need to create your charts.
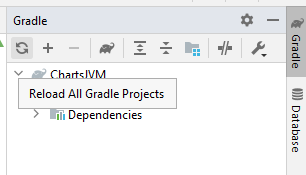
Stop your application, then reload your Gradle project by clicking on your Gradle tab's "refresh" button. You should get a BUILD SUCCESSFUL result.
Creating your first application
Now let's dive into the code and create a very simple chart to check that everything is working as expected.
Create a MyFirstChart.kt file and paste this code:
import io.data2viz.charts.chart.chart
import io.data2viz.charts.chart.mark.dot
import io.data2viz.charts.chart.quantitative
import io.data2viz.charts.viz.newVizContainer
import io.data2viz.geom.Size
import kotlinx.html.div
import kotlinx.html.dom.append
import org.w3c.dom.Node
private val width = 300.0
private val height = 300.0
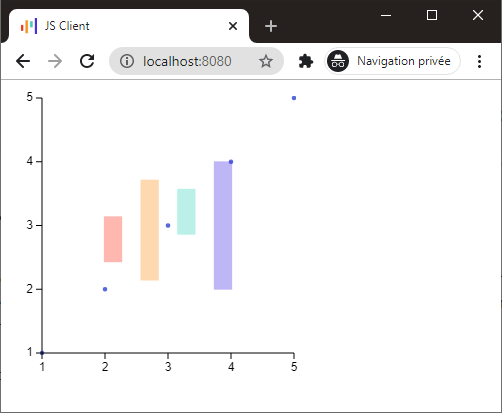
private val values = listOf(1.0, 2.0, 3.0, 4.0, 5.0)
fun Node.myFirstChart() {
append {
div {
newVizContainer().apply {
size = Size(width, height)
chart(values) {
val values = quantitative({ domain })
dot(values, values)
}
}
}
}
}
Using the kolinx.html DSL, we append to a given Node a new div tag, and in this div, we instantiate a VizContainer on which we can create a chart.
Charts-kt is a multiplatform library and the exact same code can run on multiple environments. To make this possible, Charts-kt offers the
VizContainer, an element that "hides" the platform specificities and provides a place for the chart to be drawn.
Then change the main() function to call your myFirstChart() function:
fun main() {
    window.onload = { document.body?.myFirstChart() }
}
Launch again your BrowserDevelopmentRun task and check the result (refresh your page if needed) you should see your first dot chart: