Layers & drawing zones
Charts-kt manages several layers of display and gives the visual elements the expected "drawing zone" in the expected layer, so you don't have to handle this yourself.
The layers
This is a view of a Chart layers:
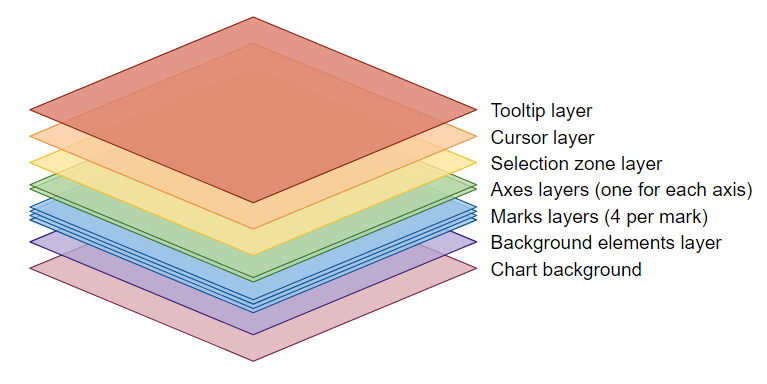
Each visual element drawing is restricted to a given layer, this ensures that, for example, the axes can't be hidden by the marks as they are always on top of them.
The marks layers
For the sake of simplification the schema displayed only a single "mark layer", but there are 4 of them for each Mark in the chart:
- highlighted marks (top)
- selected marks
- marks
- marks background like drop shadow (bottom)
Keep in mind that drawing on a layer (for example when you draw a highlighted mark on the marks top layer) does not clear the other layers.
The axes layers
As for the marks, there are as many axis layer as axes displayed in the chart.
The background elements layer
This layer is used to draw background elements like the "alternate backgrounds", or the "grid lines" to increase the readability of your chart.
Chart background
The chart background layer is simply filled with a solid color.
The drawing Zones
A DrawingZone is an on-screen zone defined by its position and its size.
Before drawing anything on the screen, Charts-kt computes the drawing zones, and when the visual elements draw functions are called the correct DrawingZone is set as a parameter.
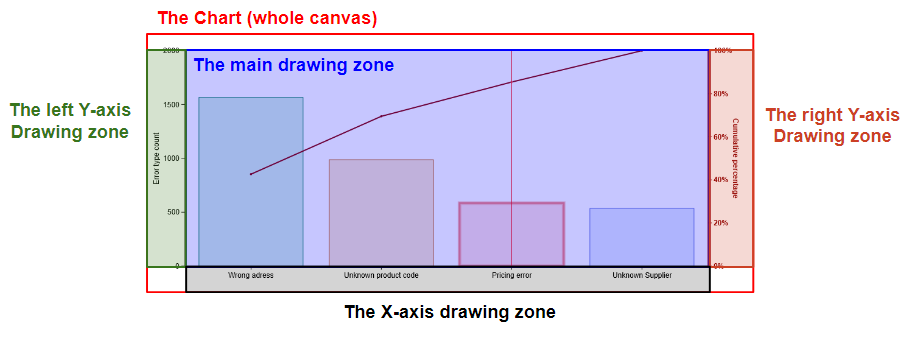
Let's have a look at the Mark interface drawMark function:
public interface Mark<DOMAIN> {

    public fun drawMark(drawingZone: DrawingZone, dataset: Dataset<DOMAIN>) { }

    (...)
}
When this function is called, you have the direct information of the main drawing zone (in blue on the schema).
You can just draw on it, the origin coordinates will be the top-left corner of the DrawingZone and you do not have to worry about the position and the layout of your Mark.
Also, you do not have to worry about the layering of your drawing, as Charts-kt manage this for you.
For example, if you are calling the drawMark function of the ColumnMark here, anything your draw will be under the cursor, and the LineMark which is expected to be on top.
The
DrawingZonegiven as a parameter of the "draw" functions is for its use only. So, you generally start by callingdrawingZone.clear()before drawing on it but this is not mandatory and you may want to try other methods.